Projected Climate Maps for Nova Scotia
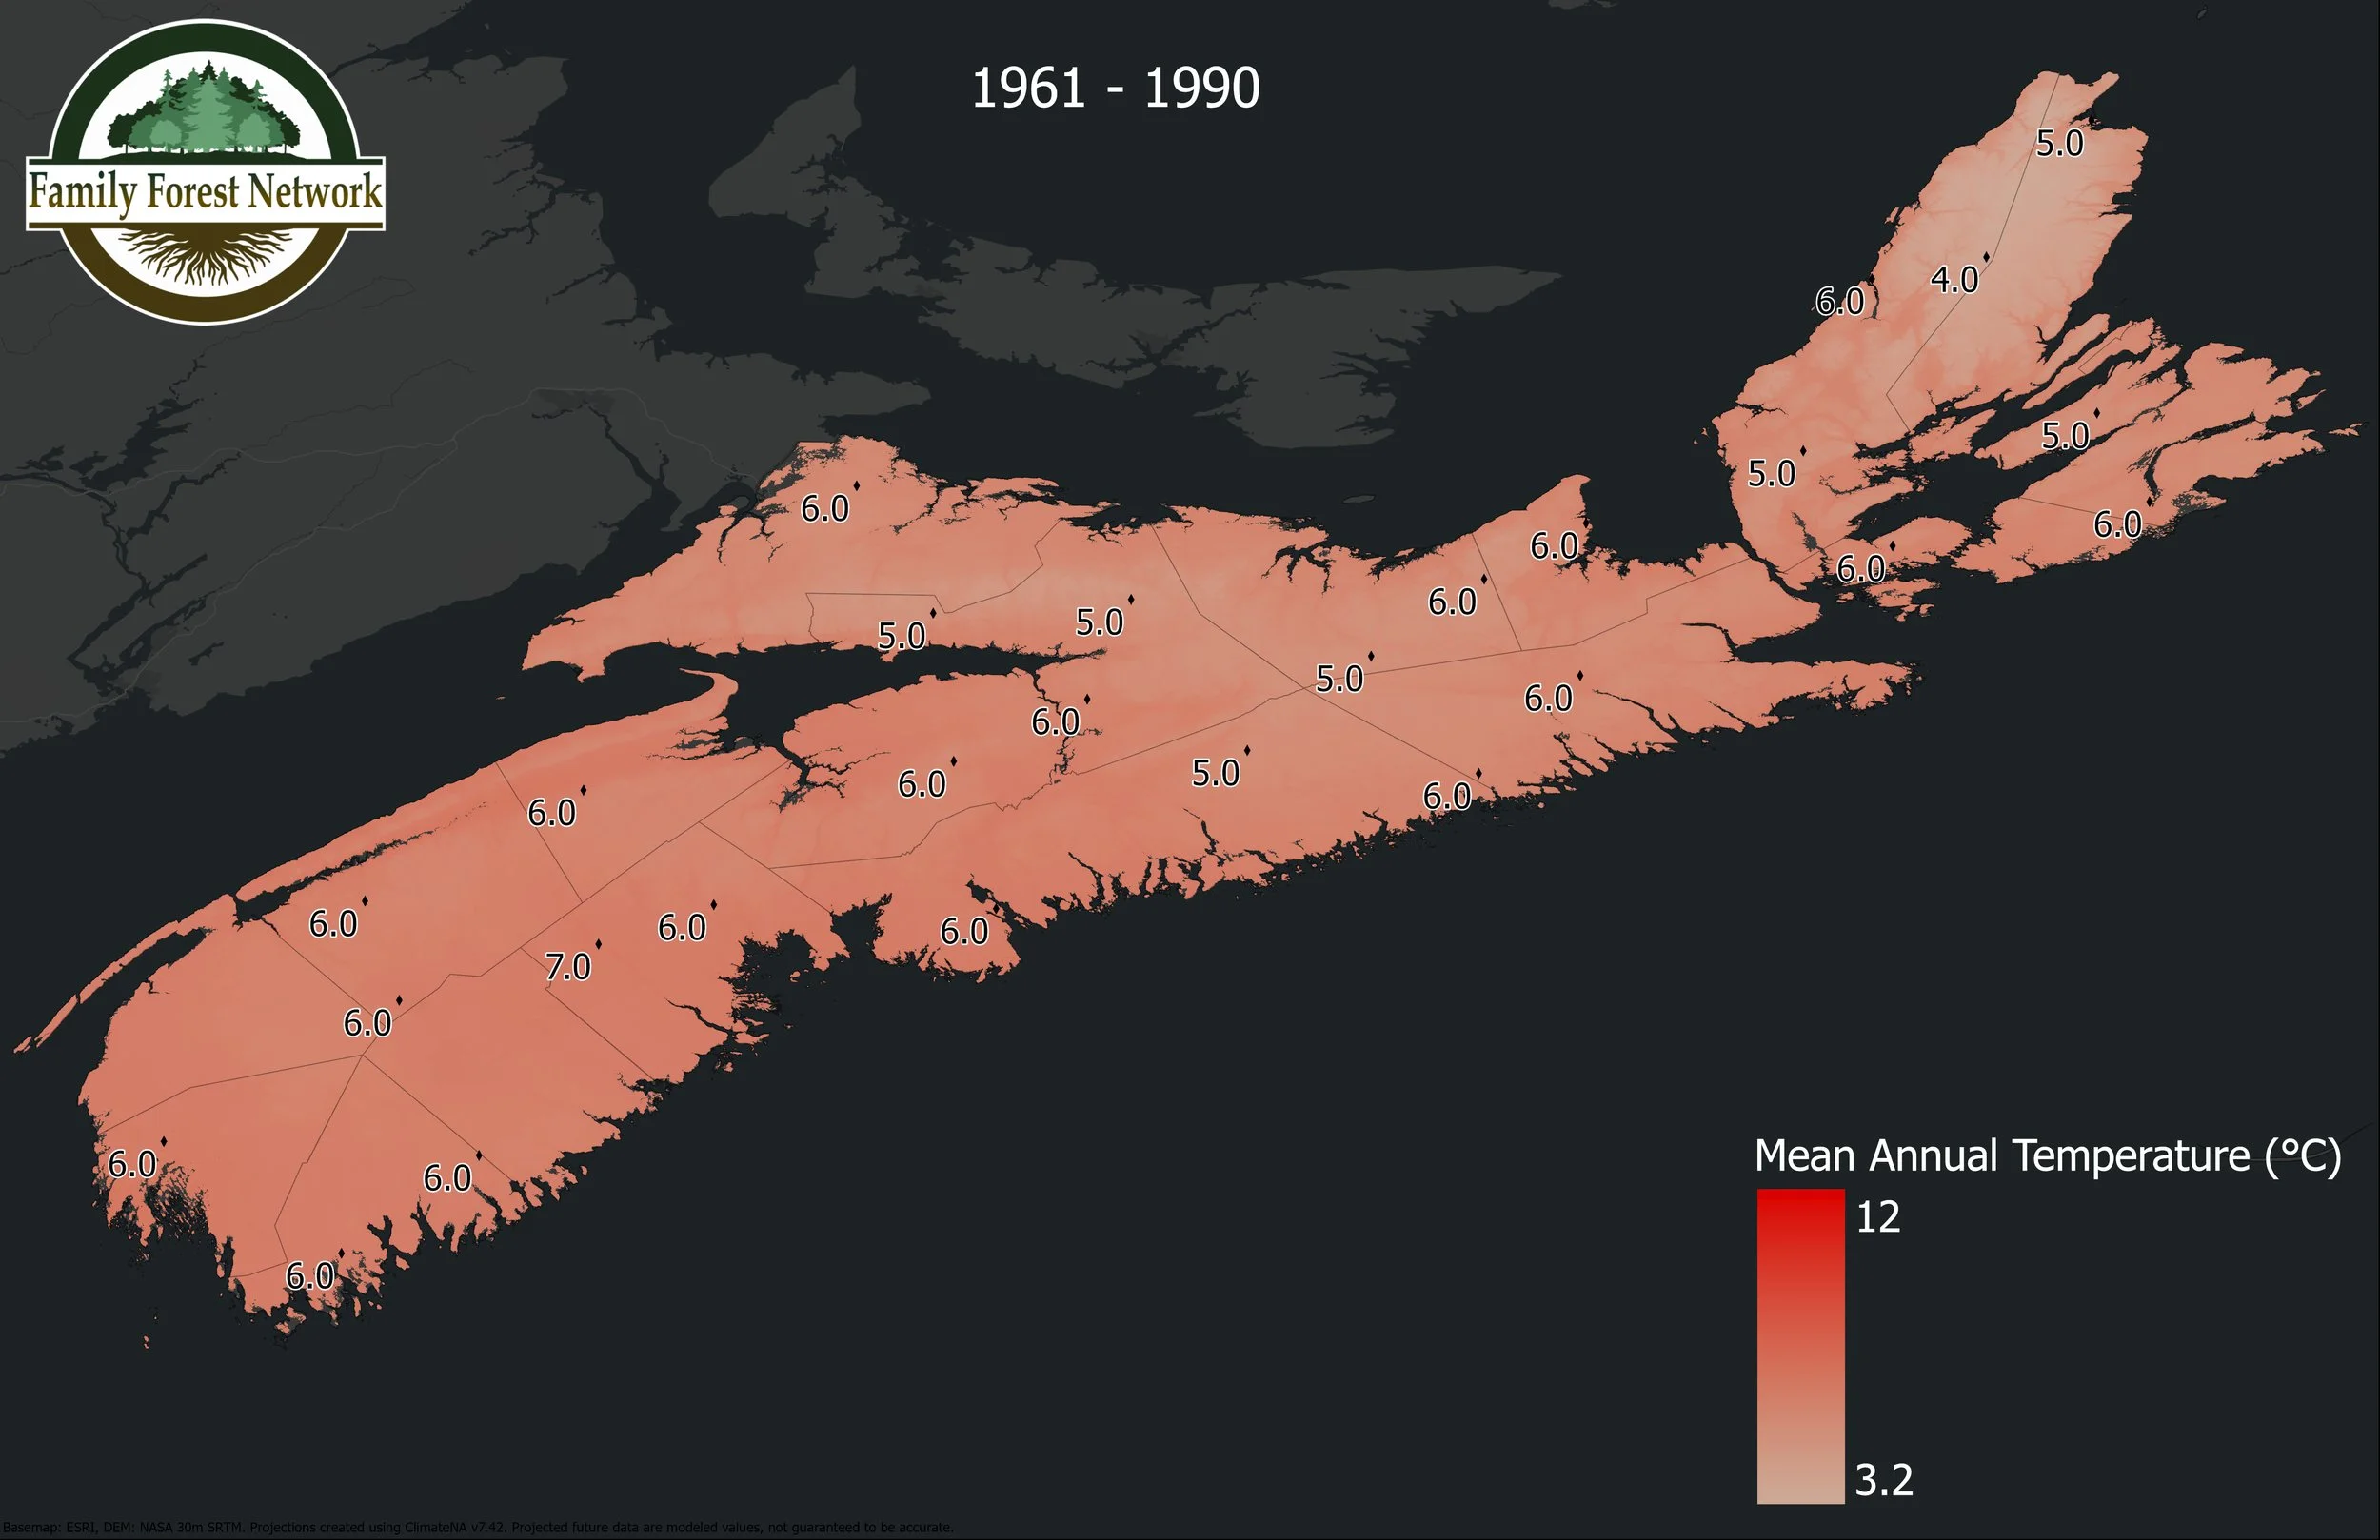
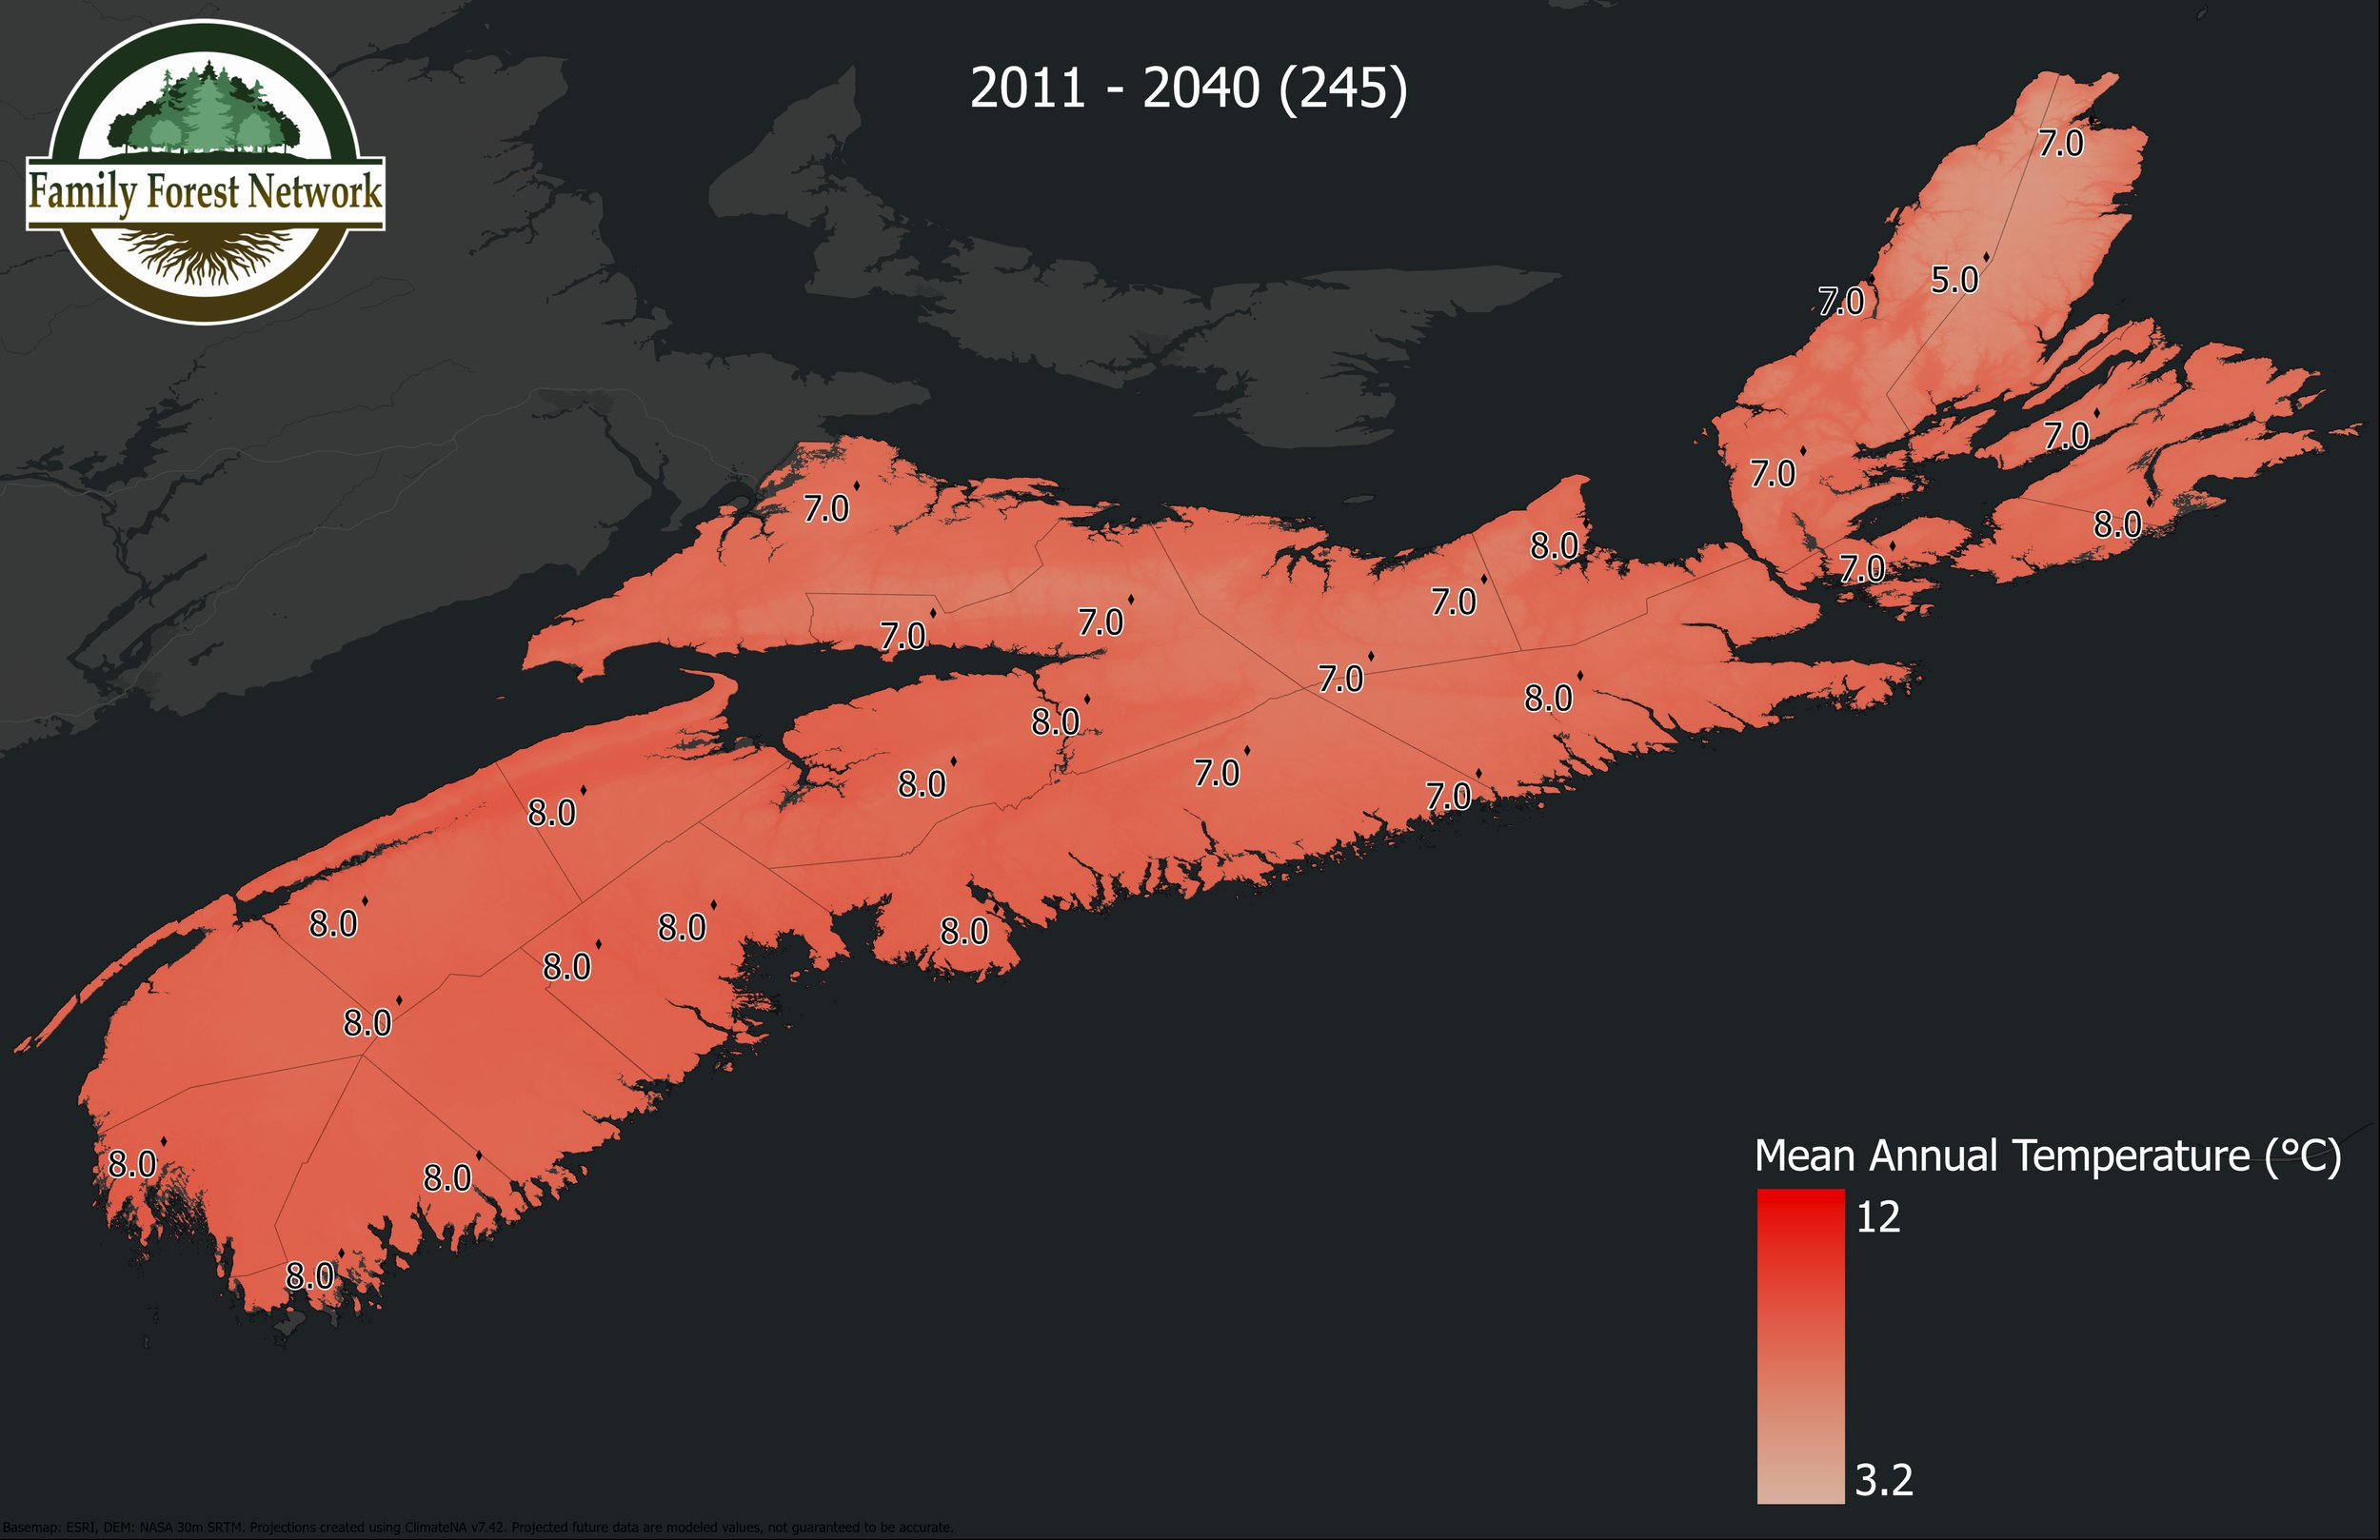
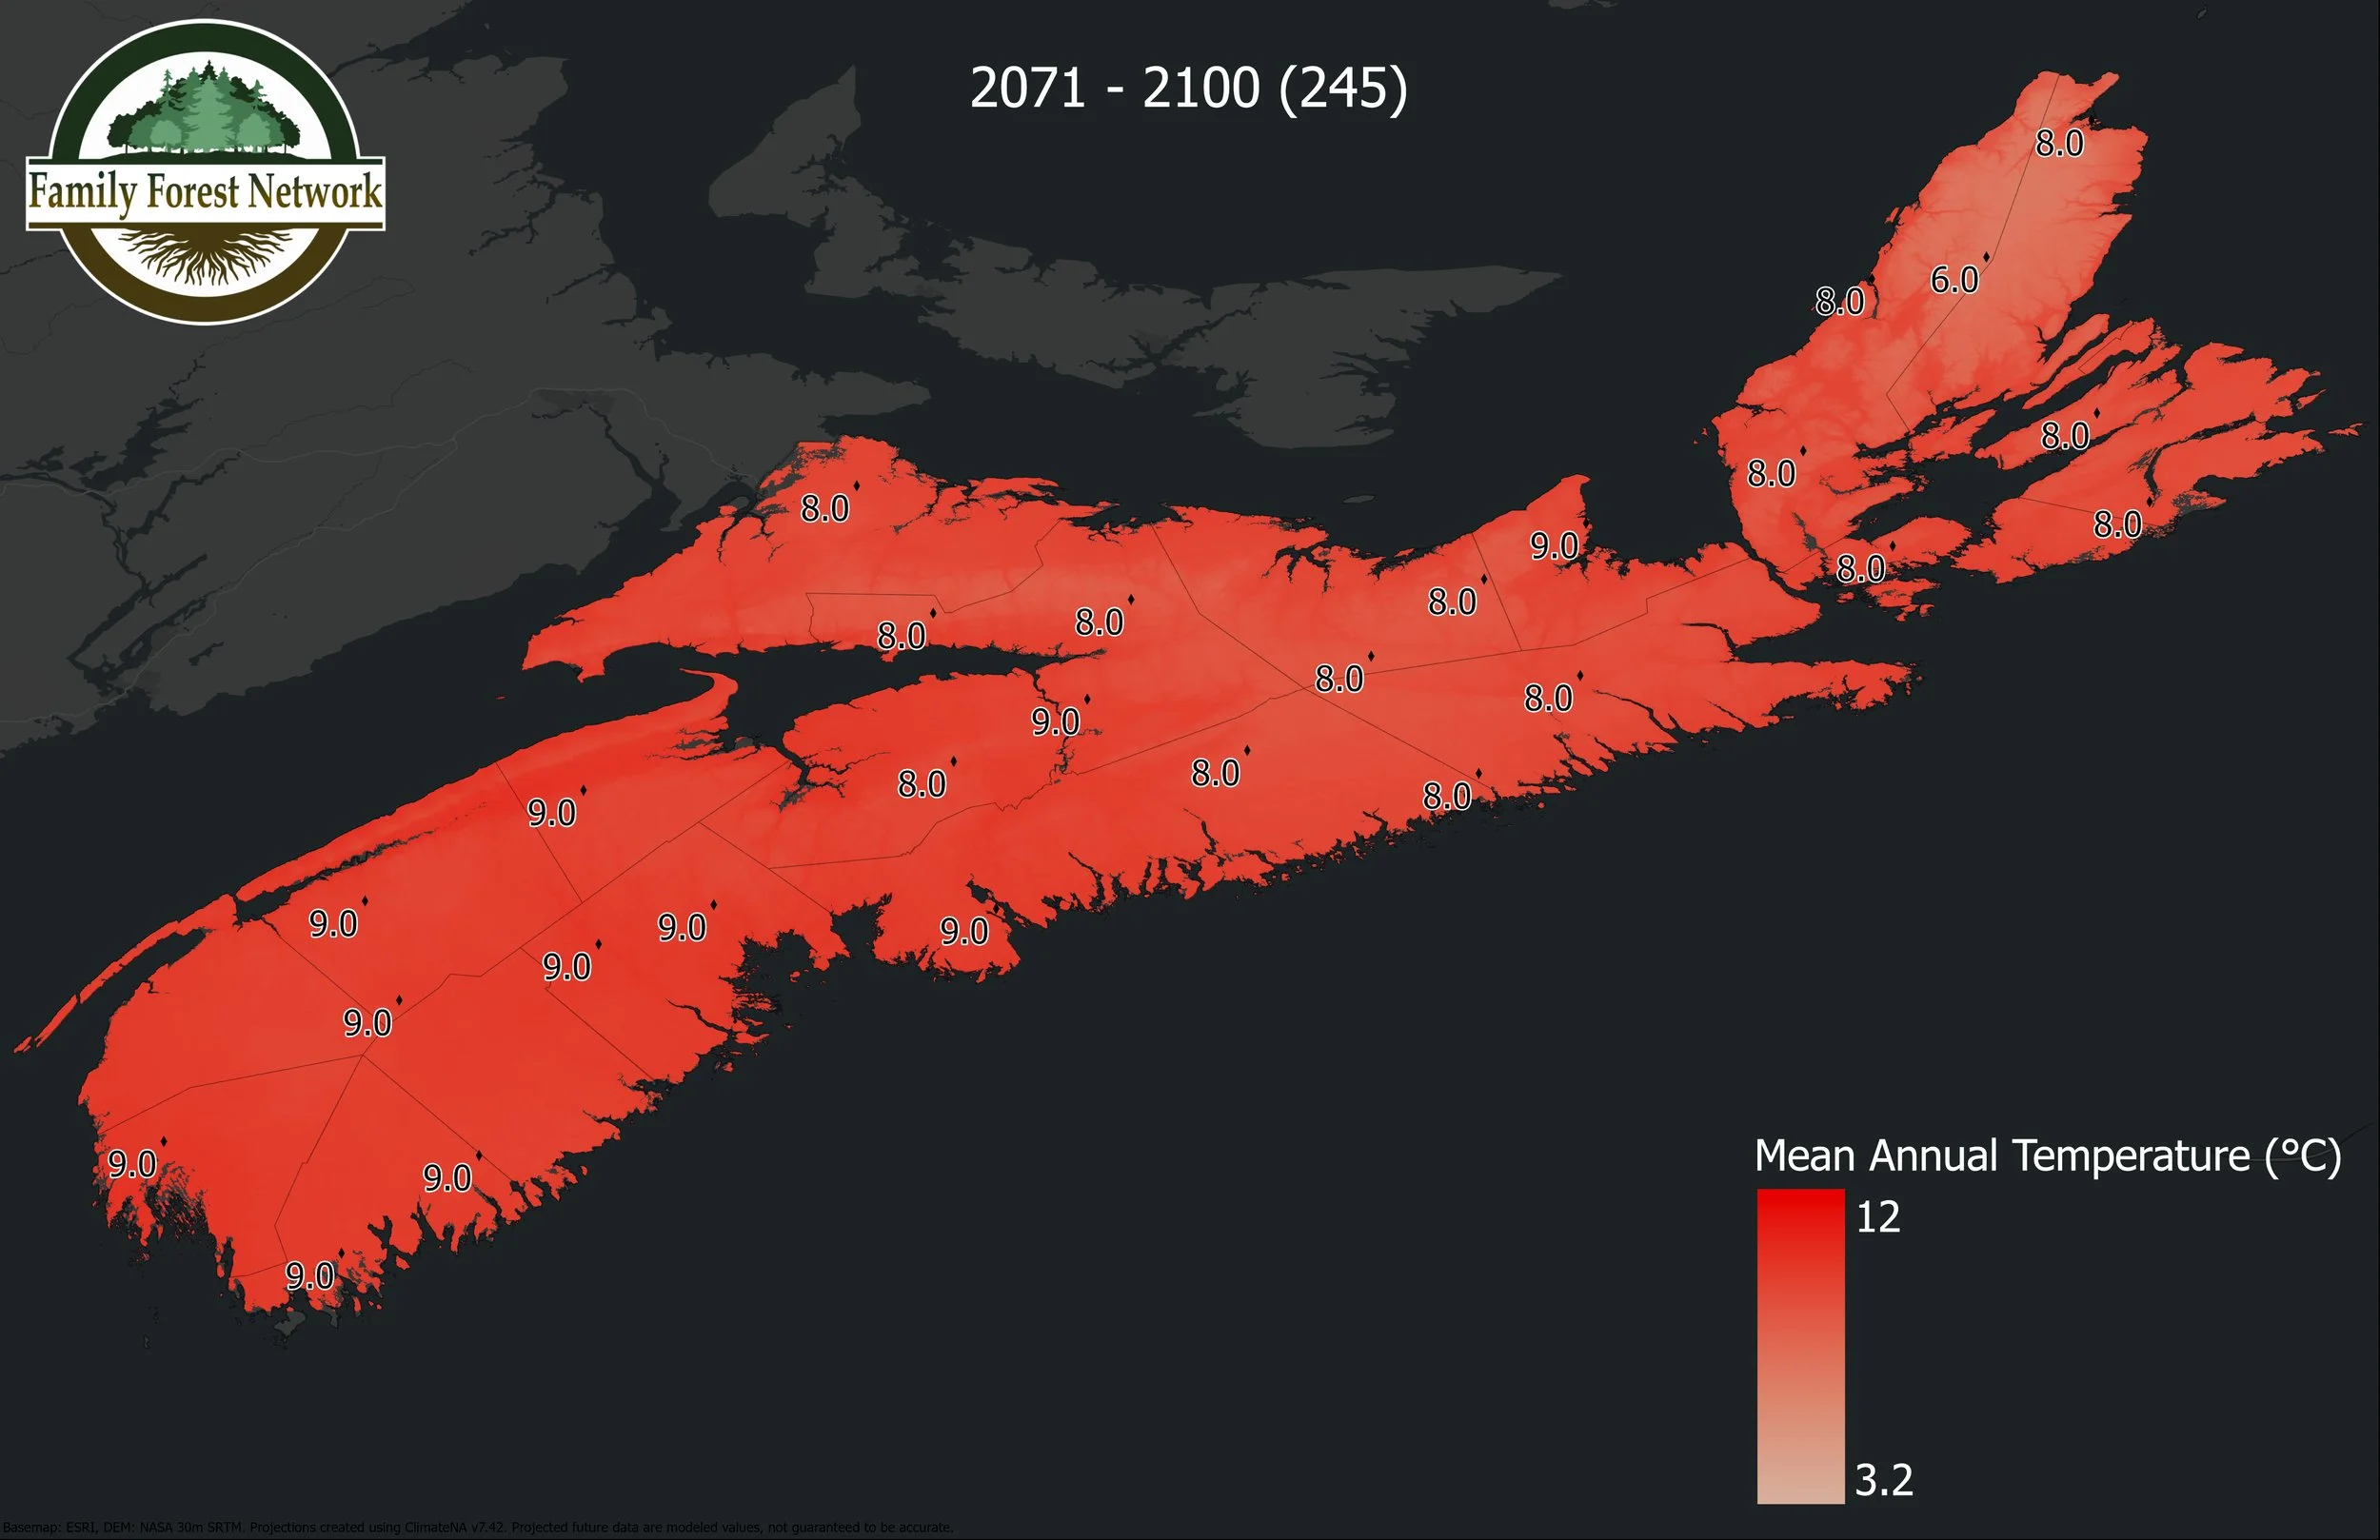
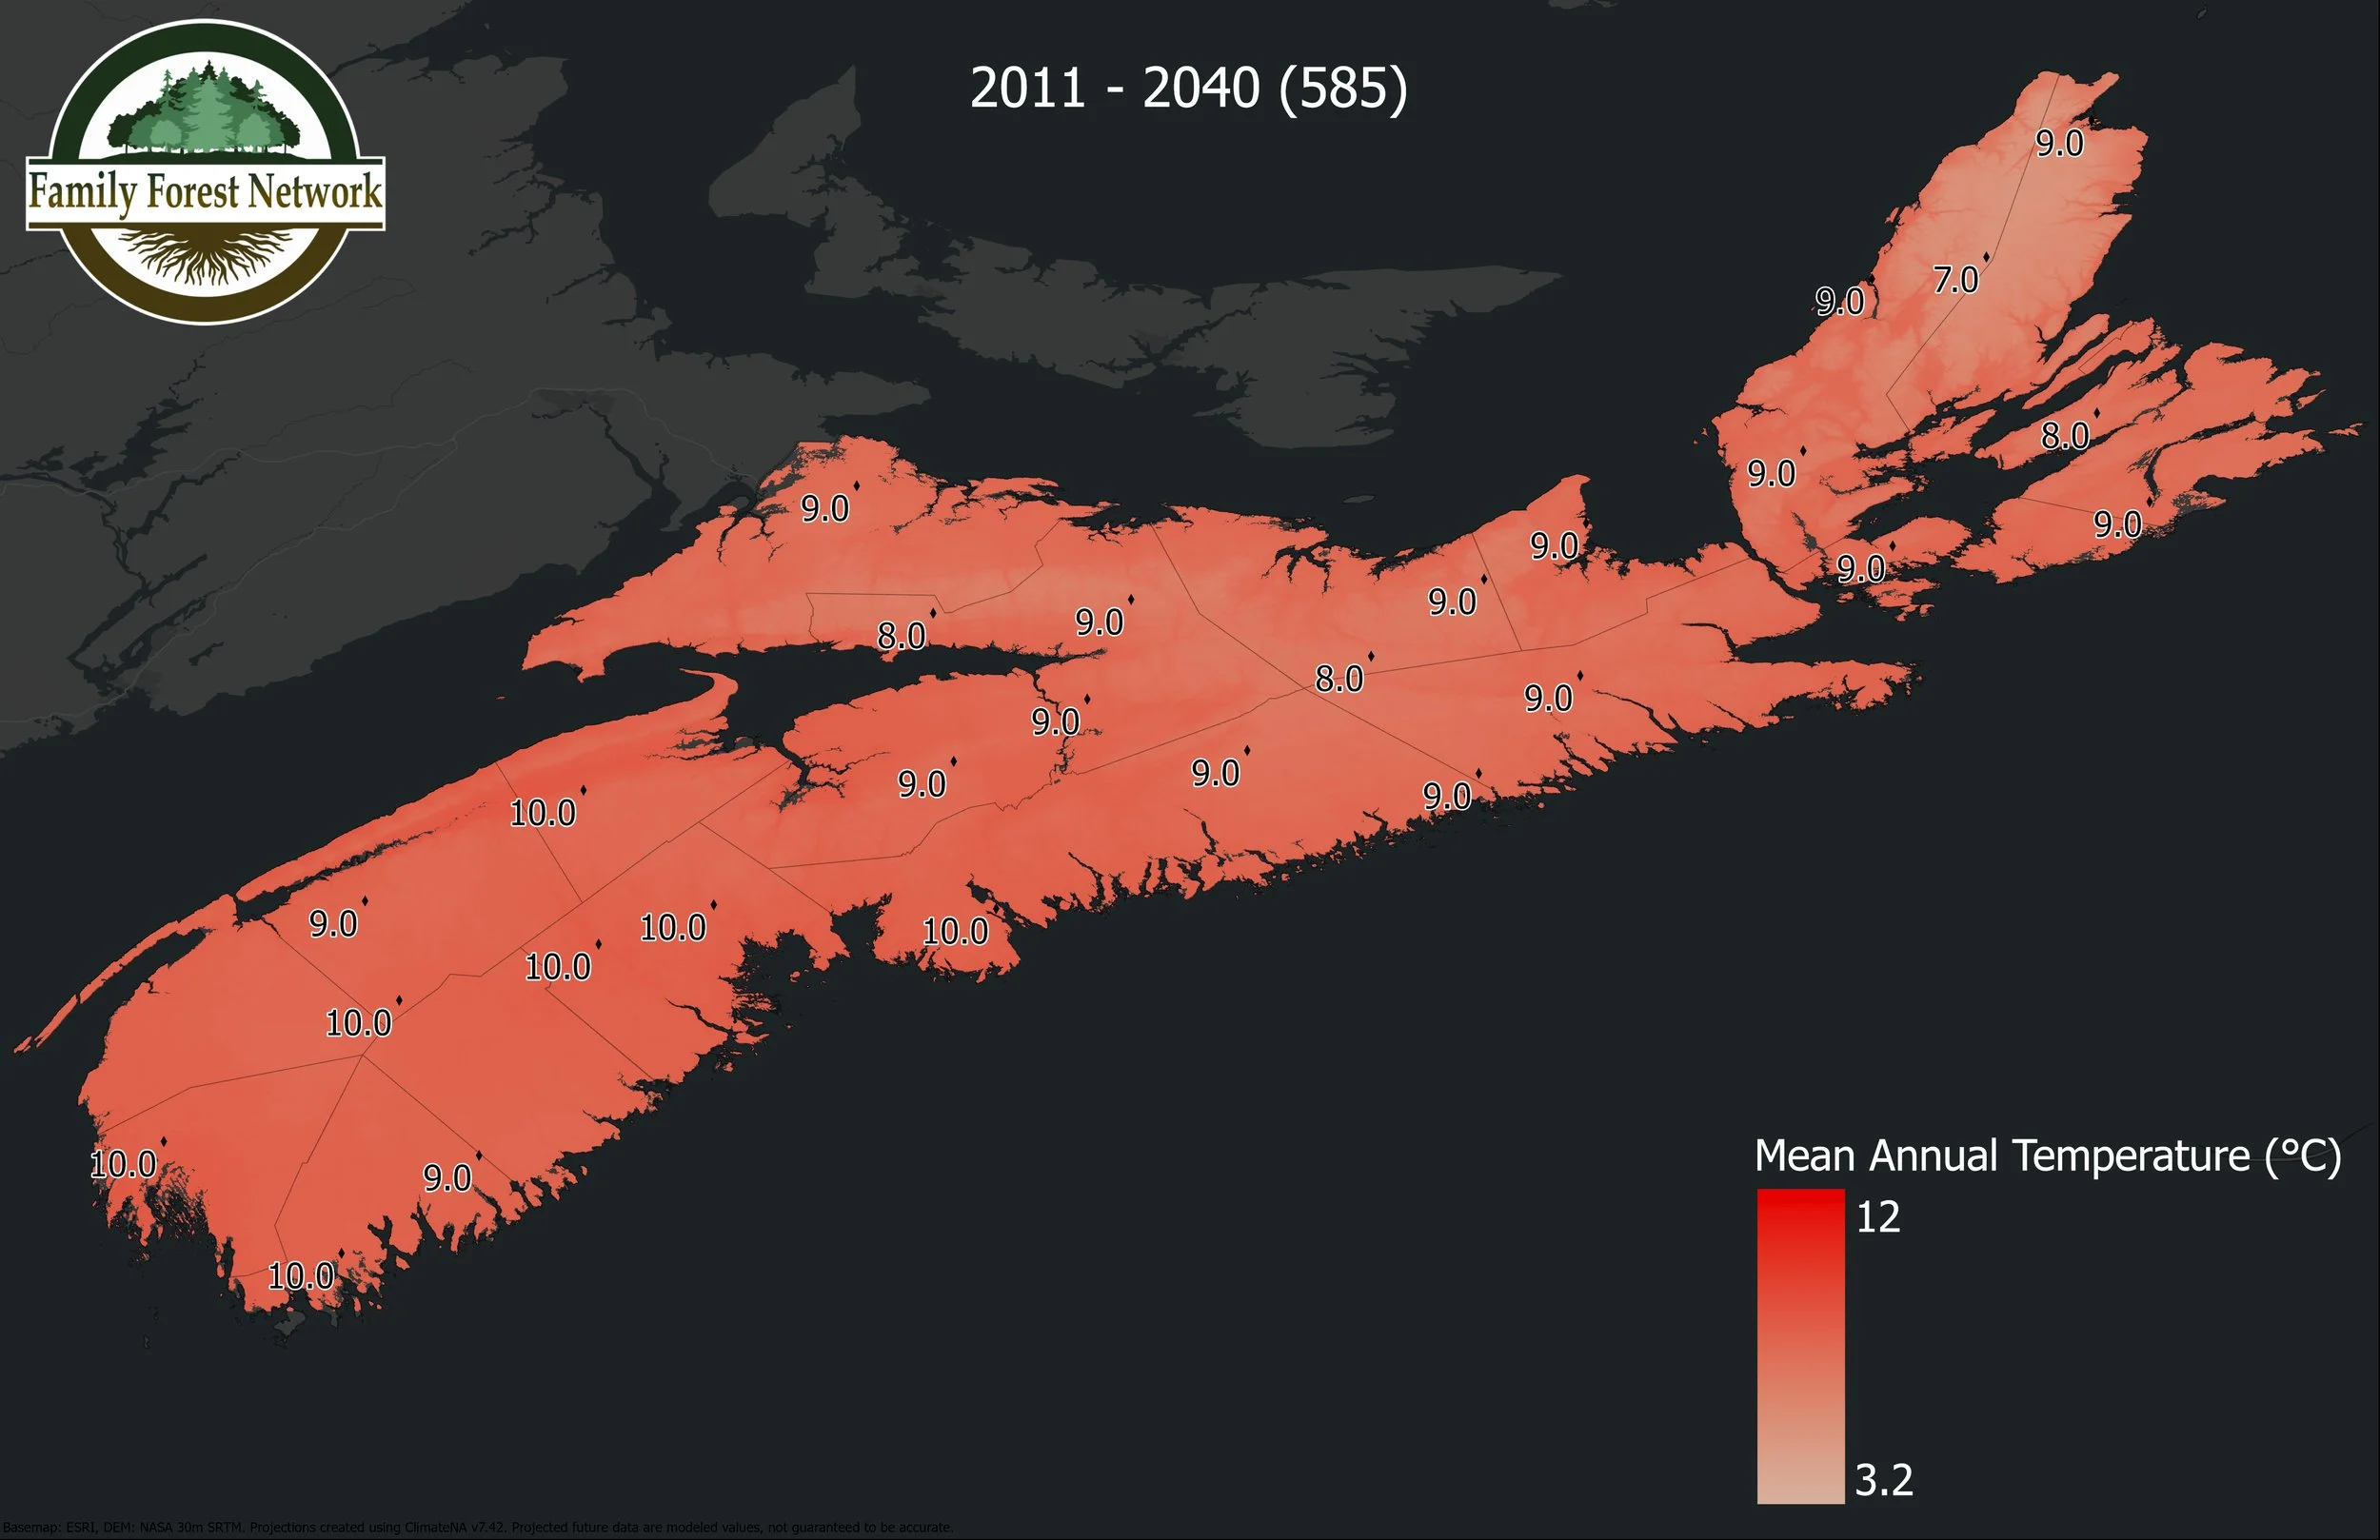
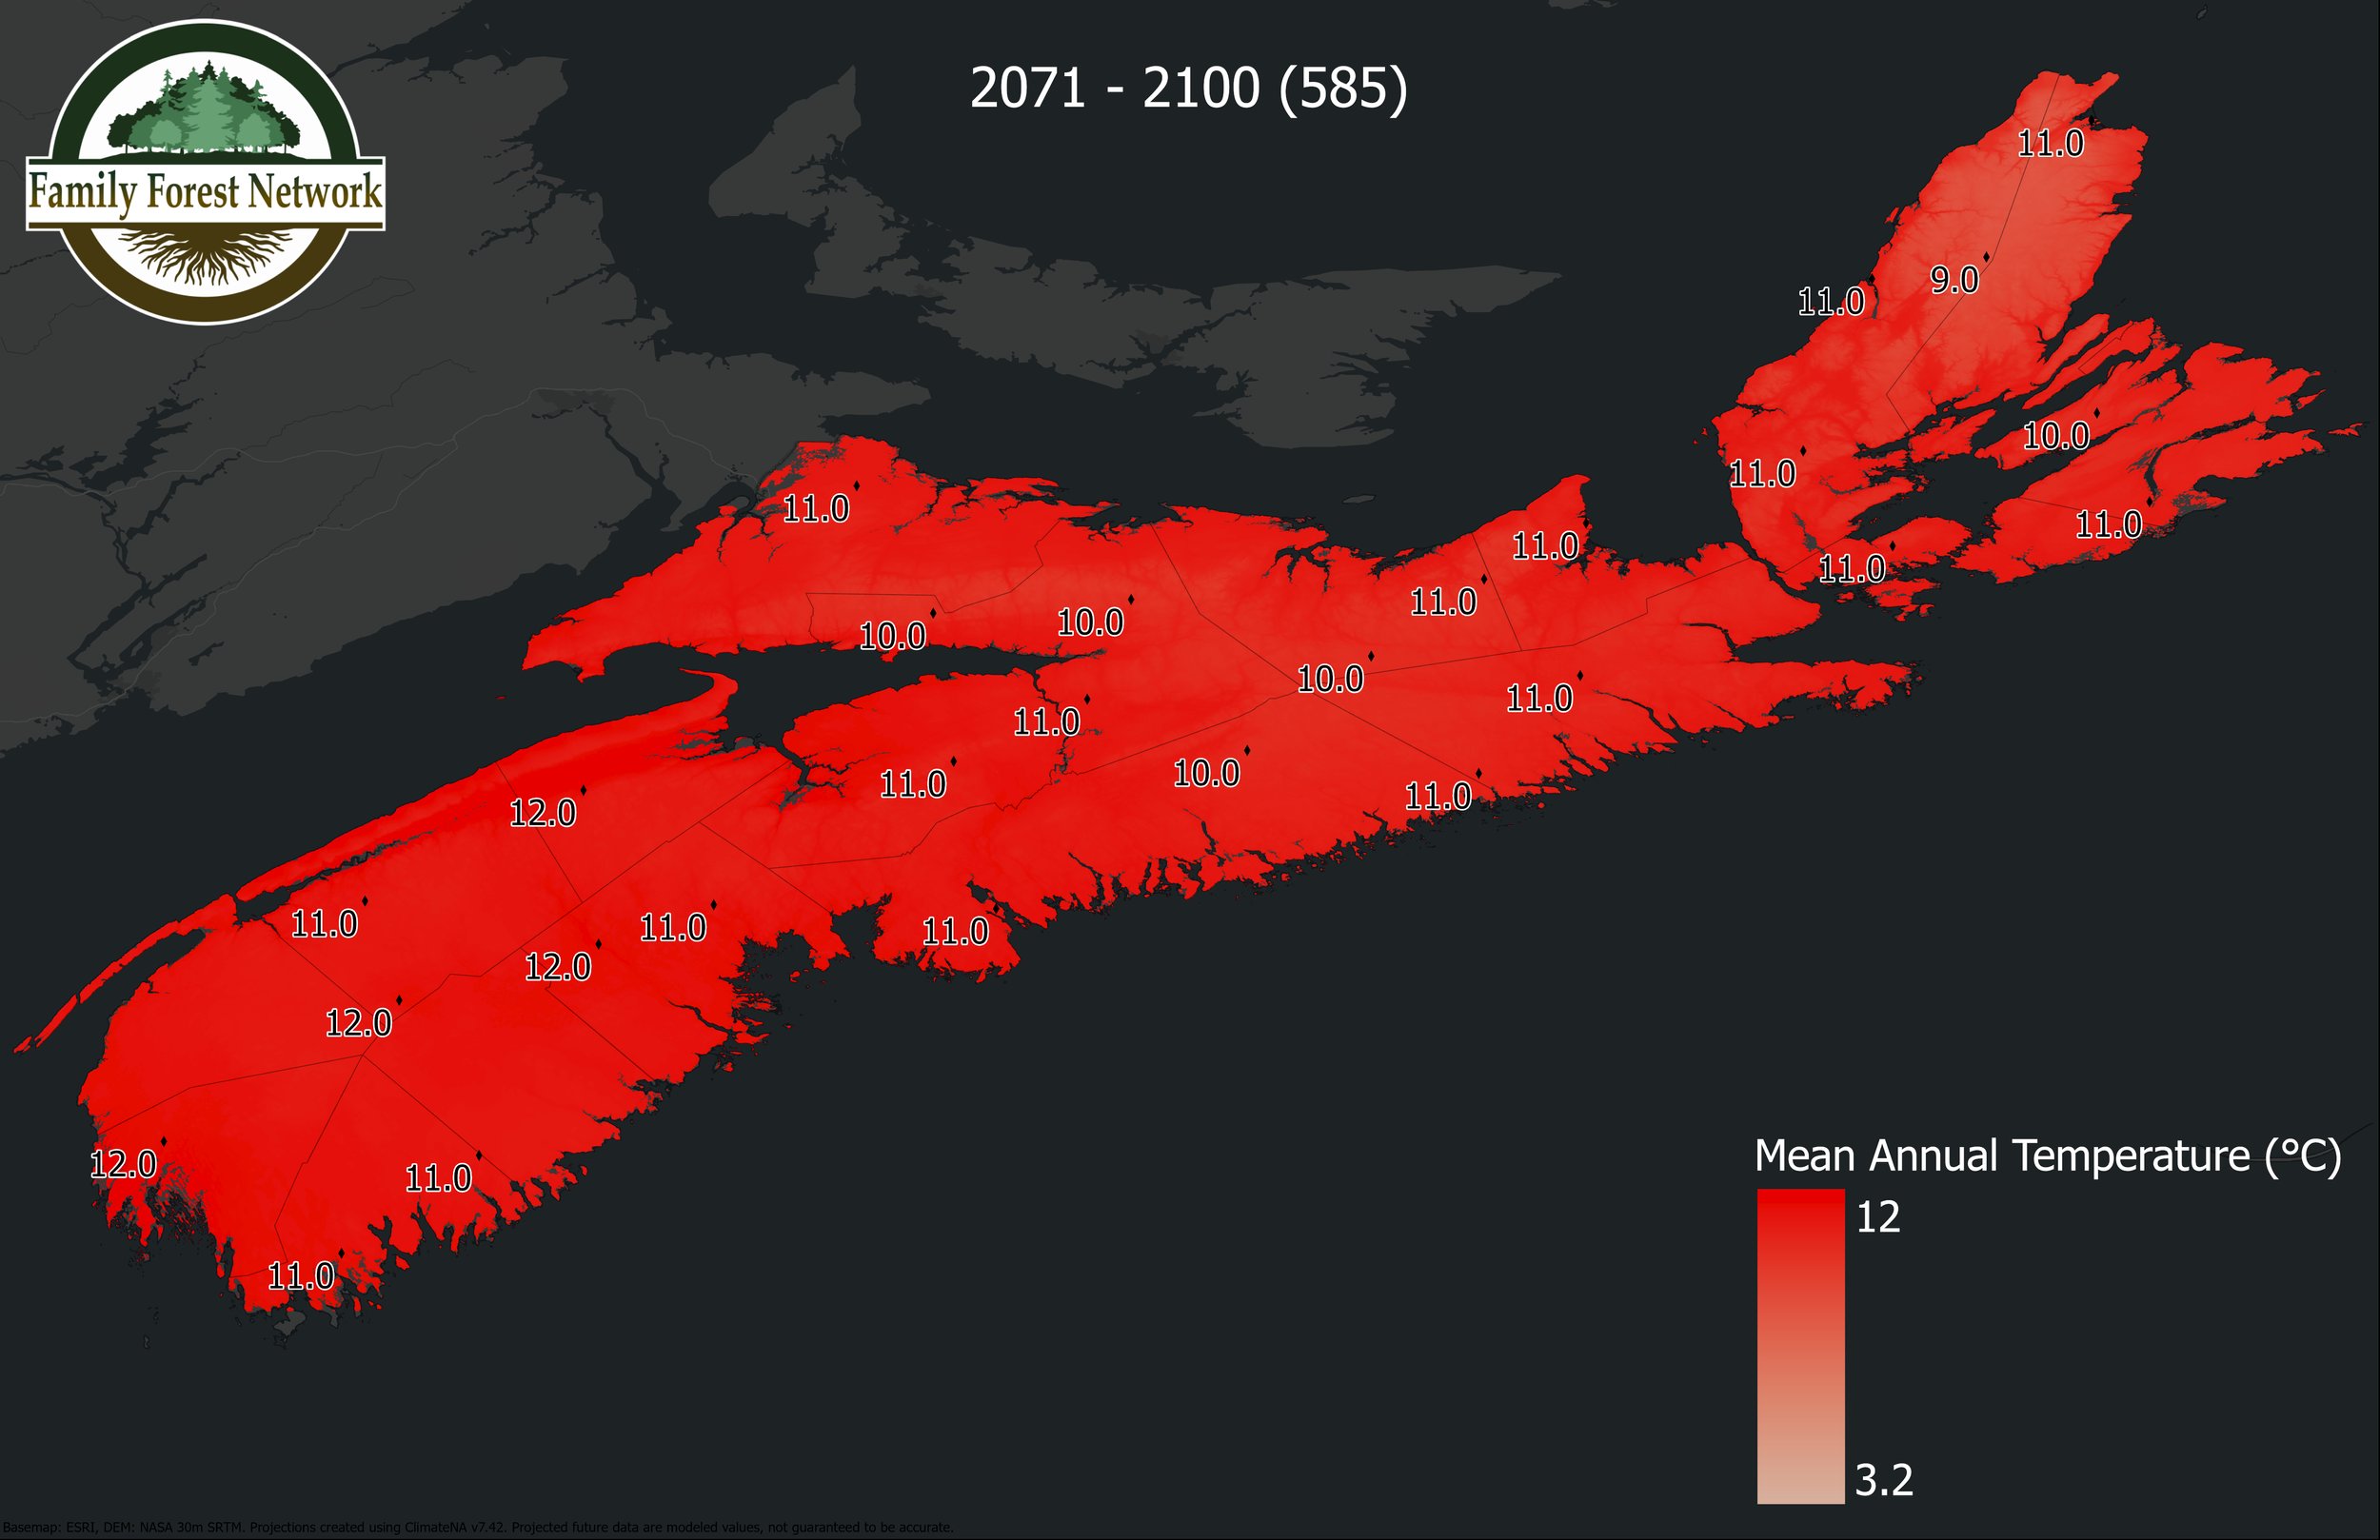
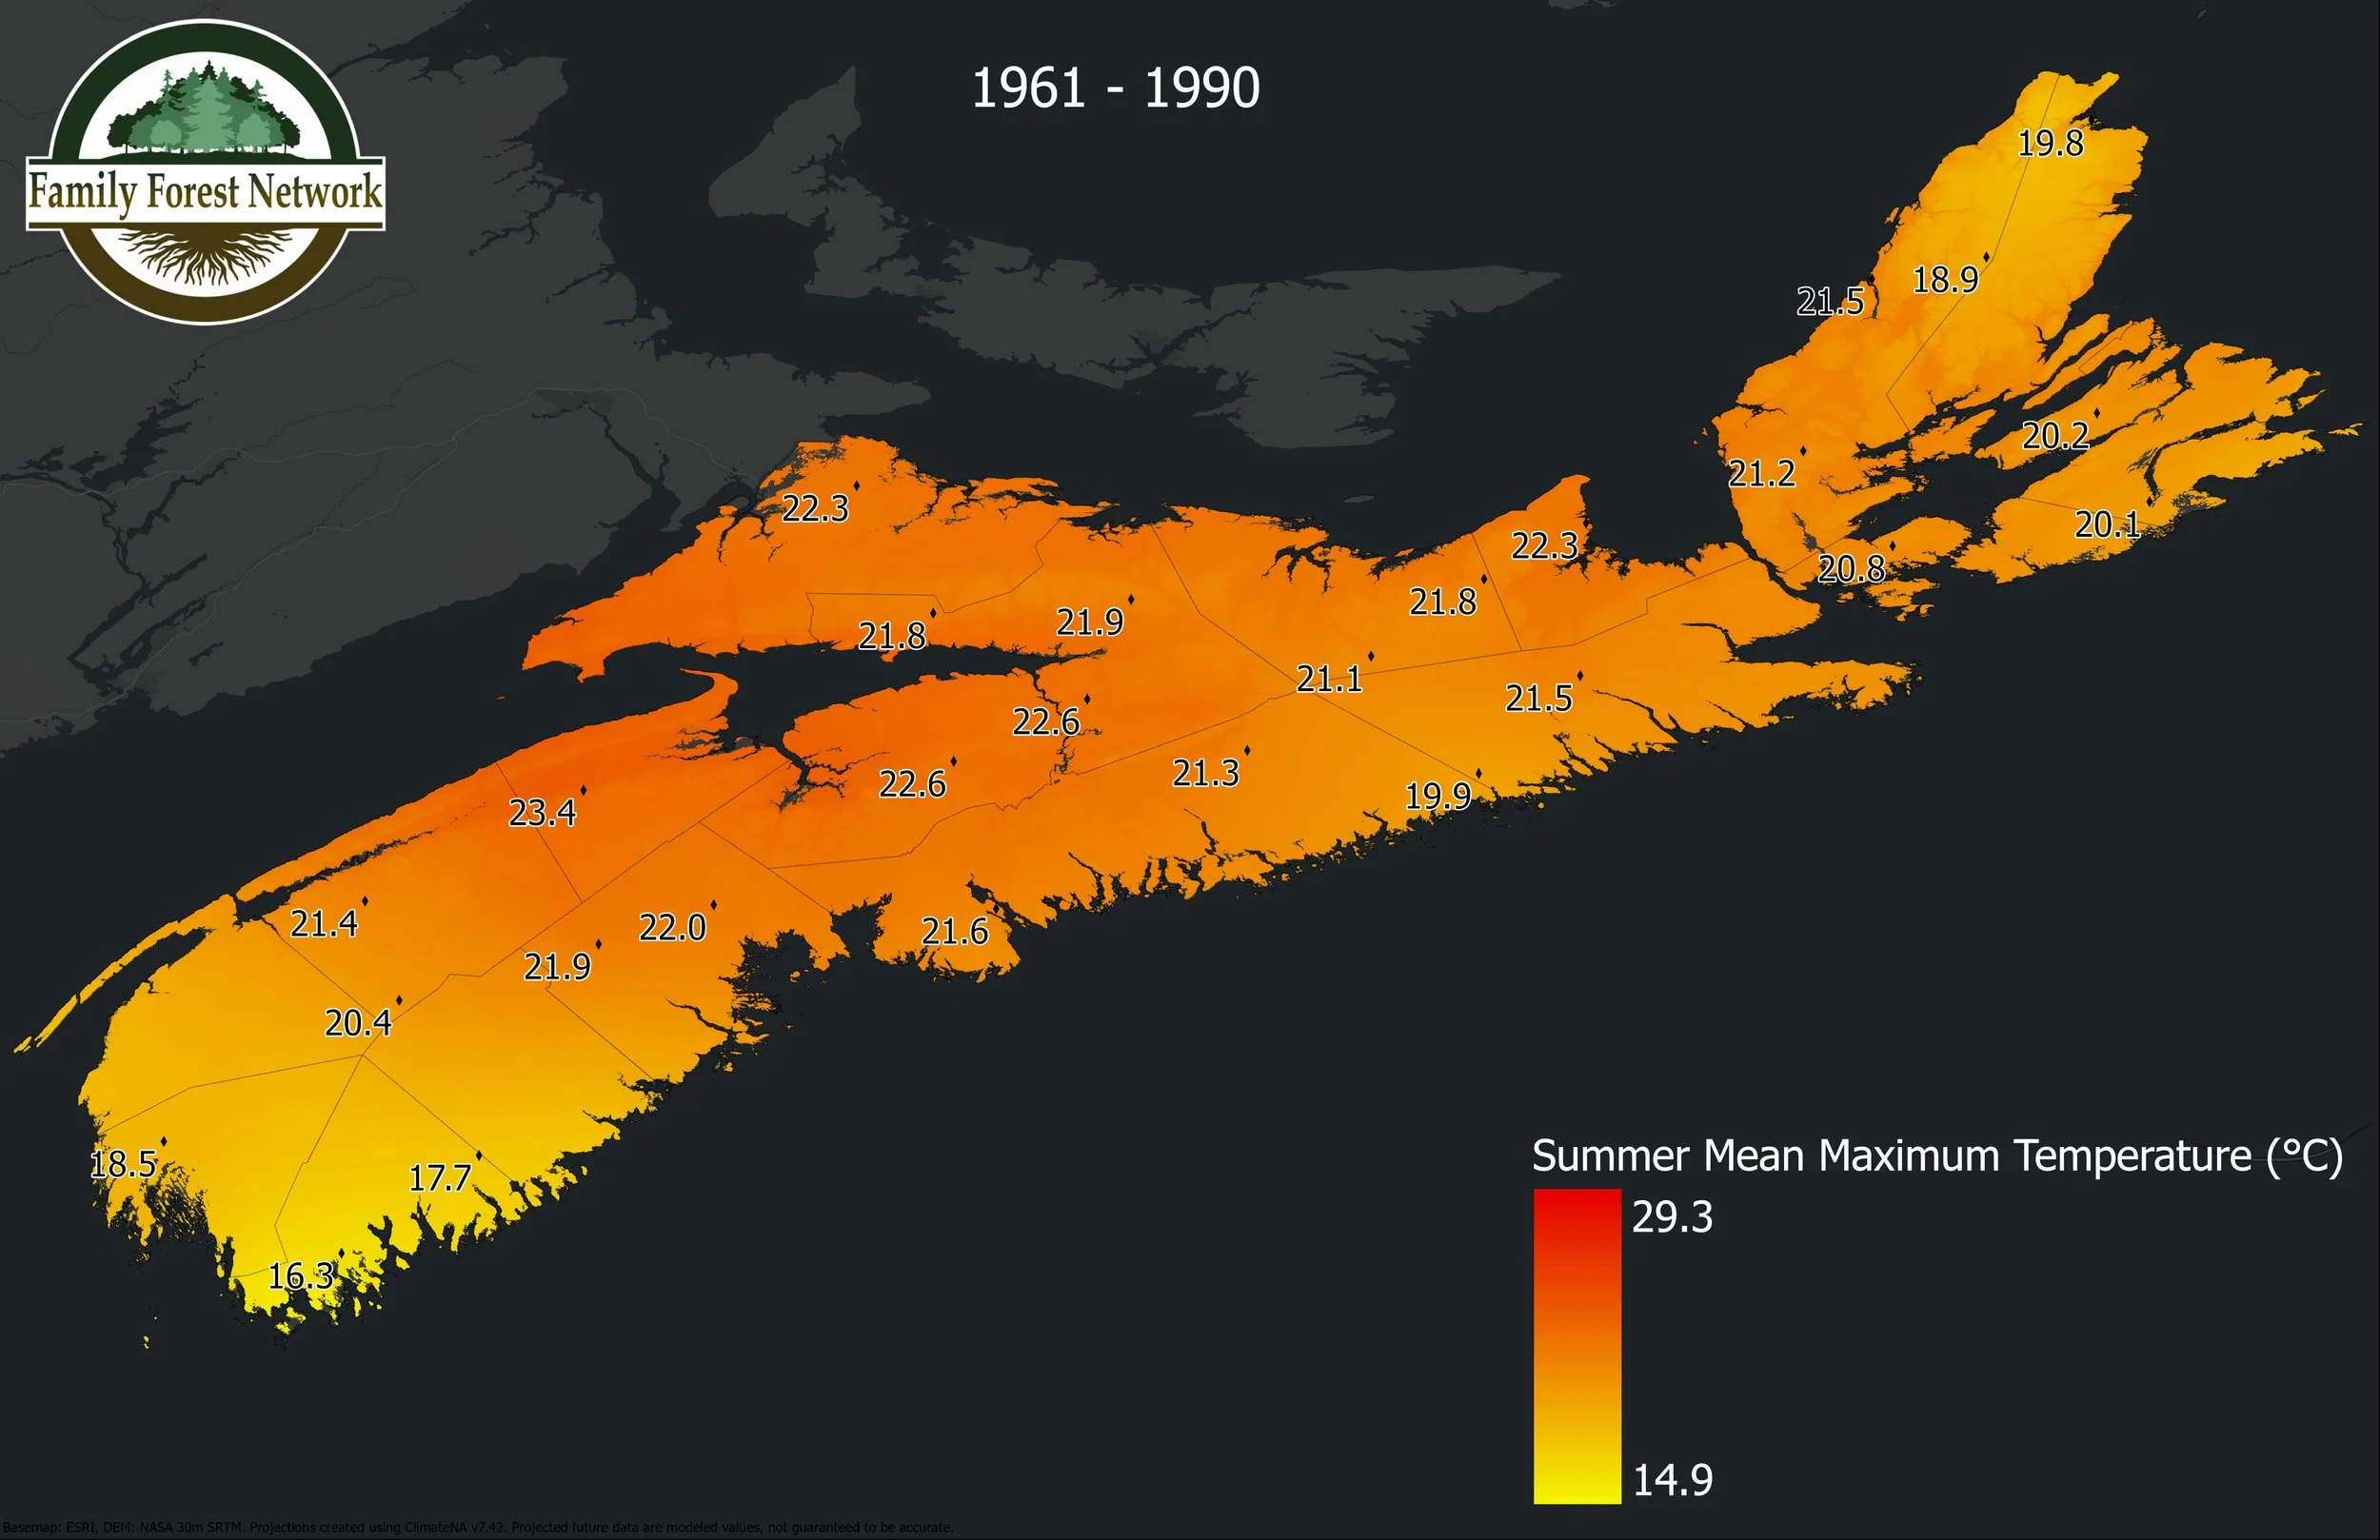
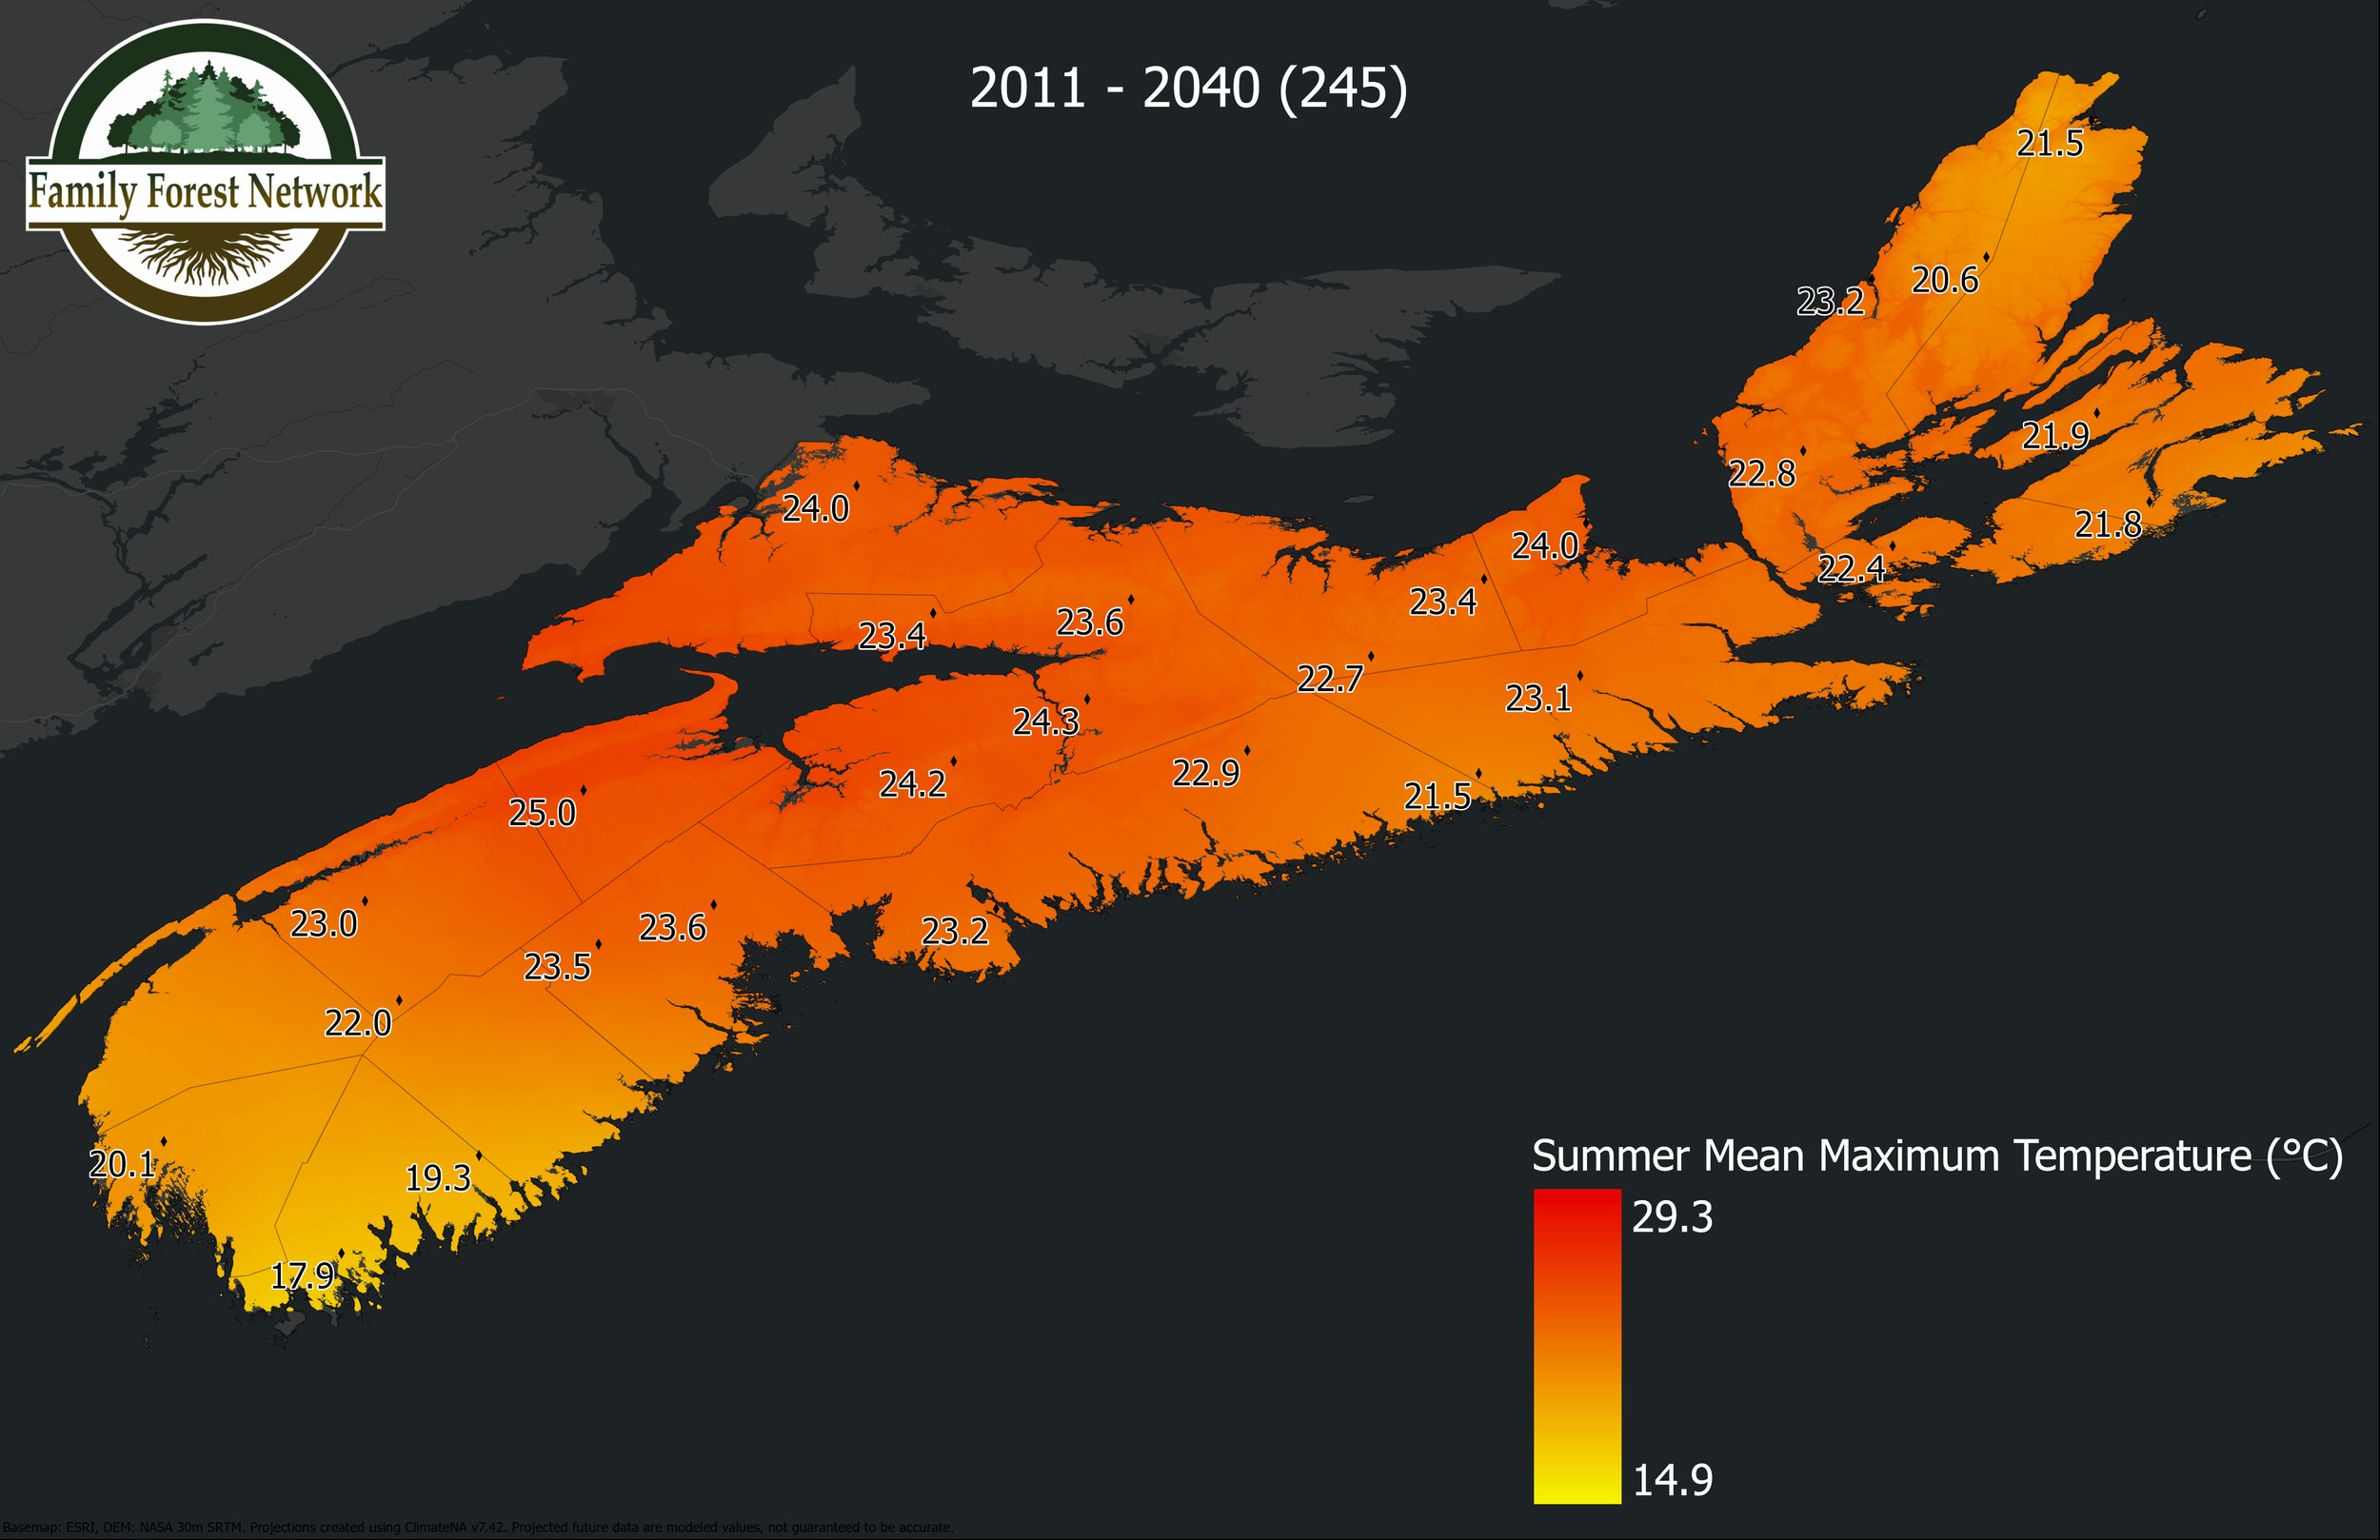
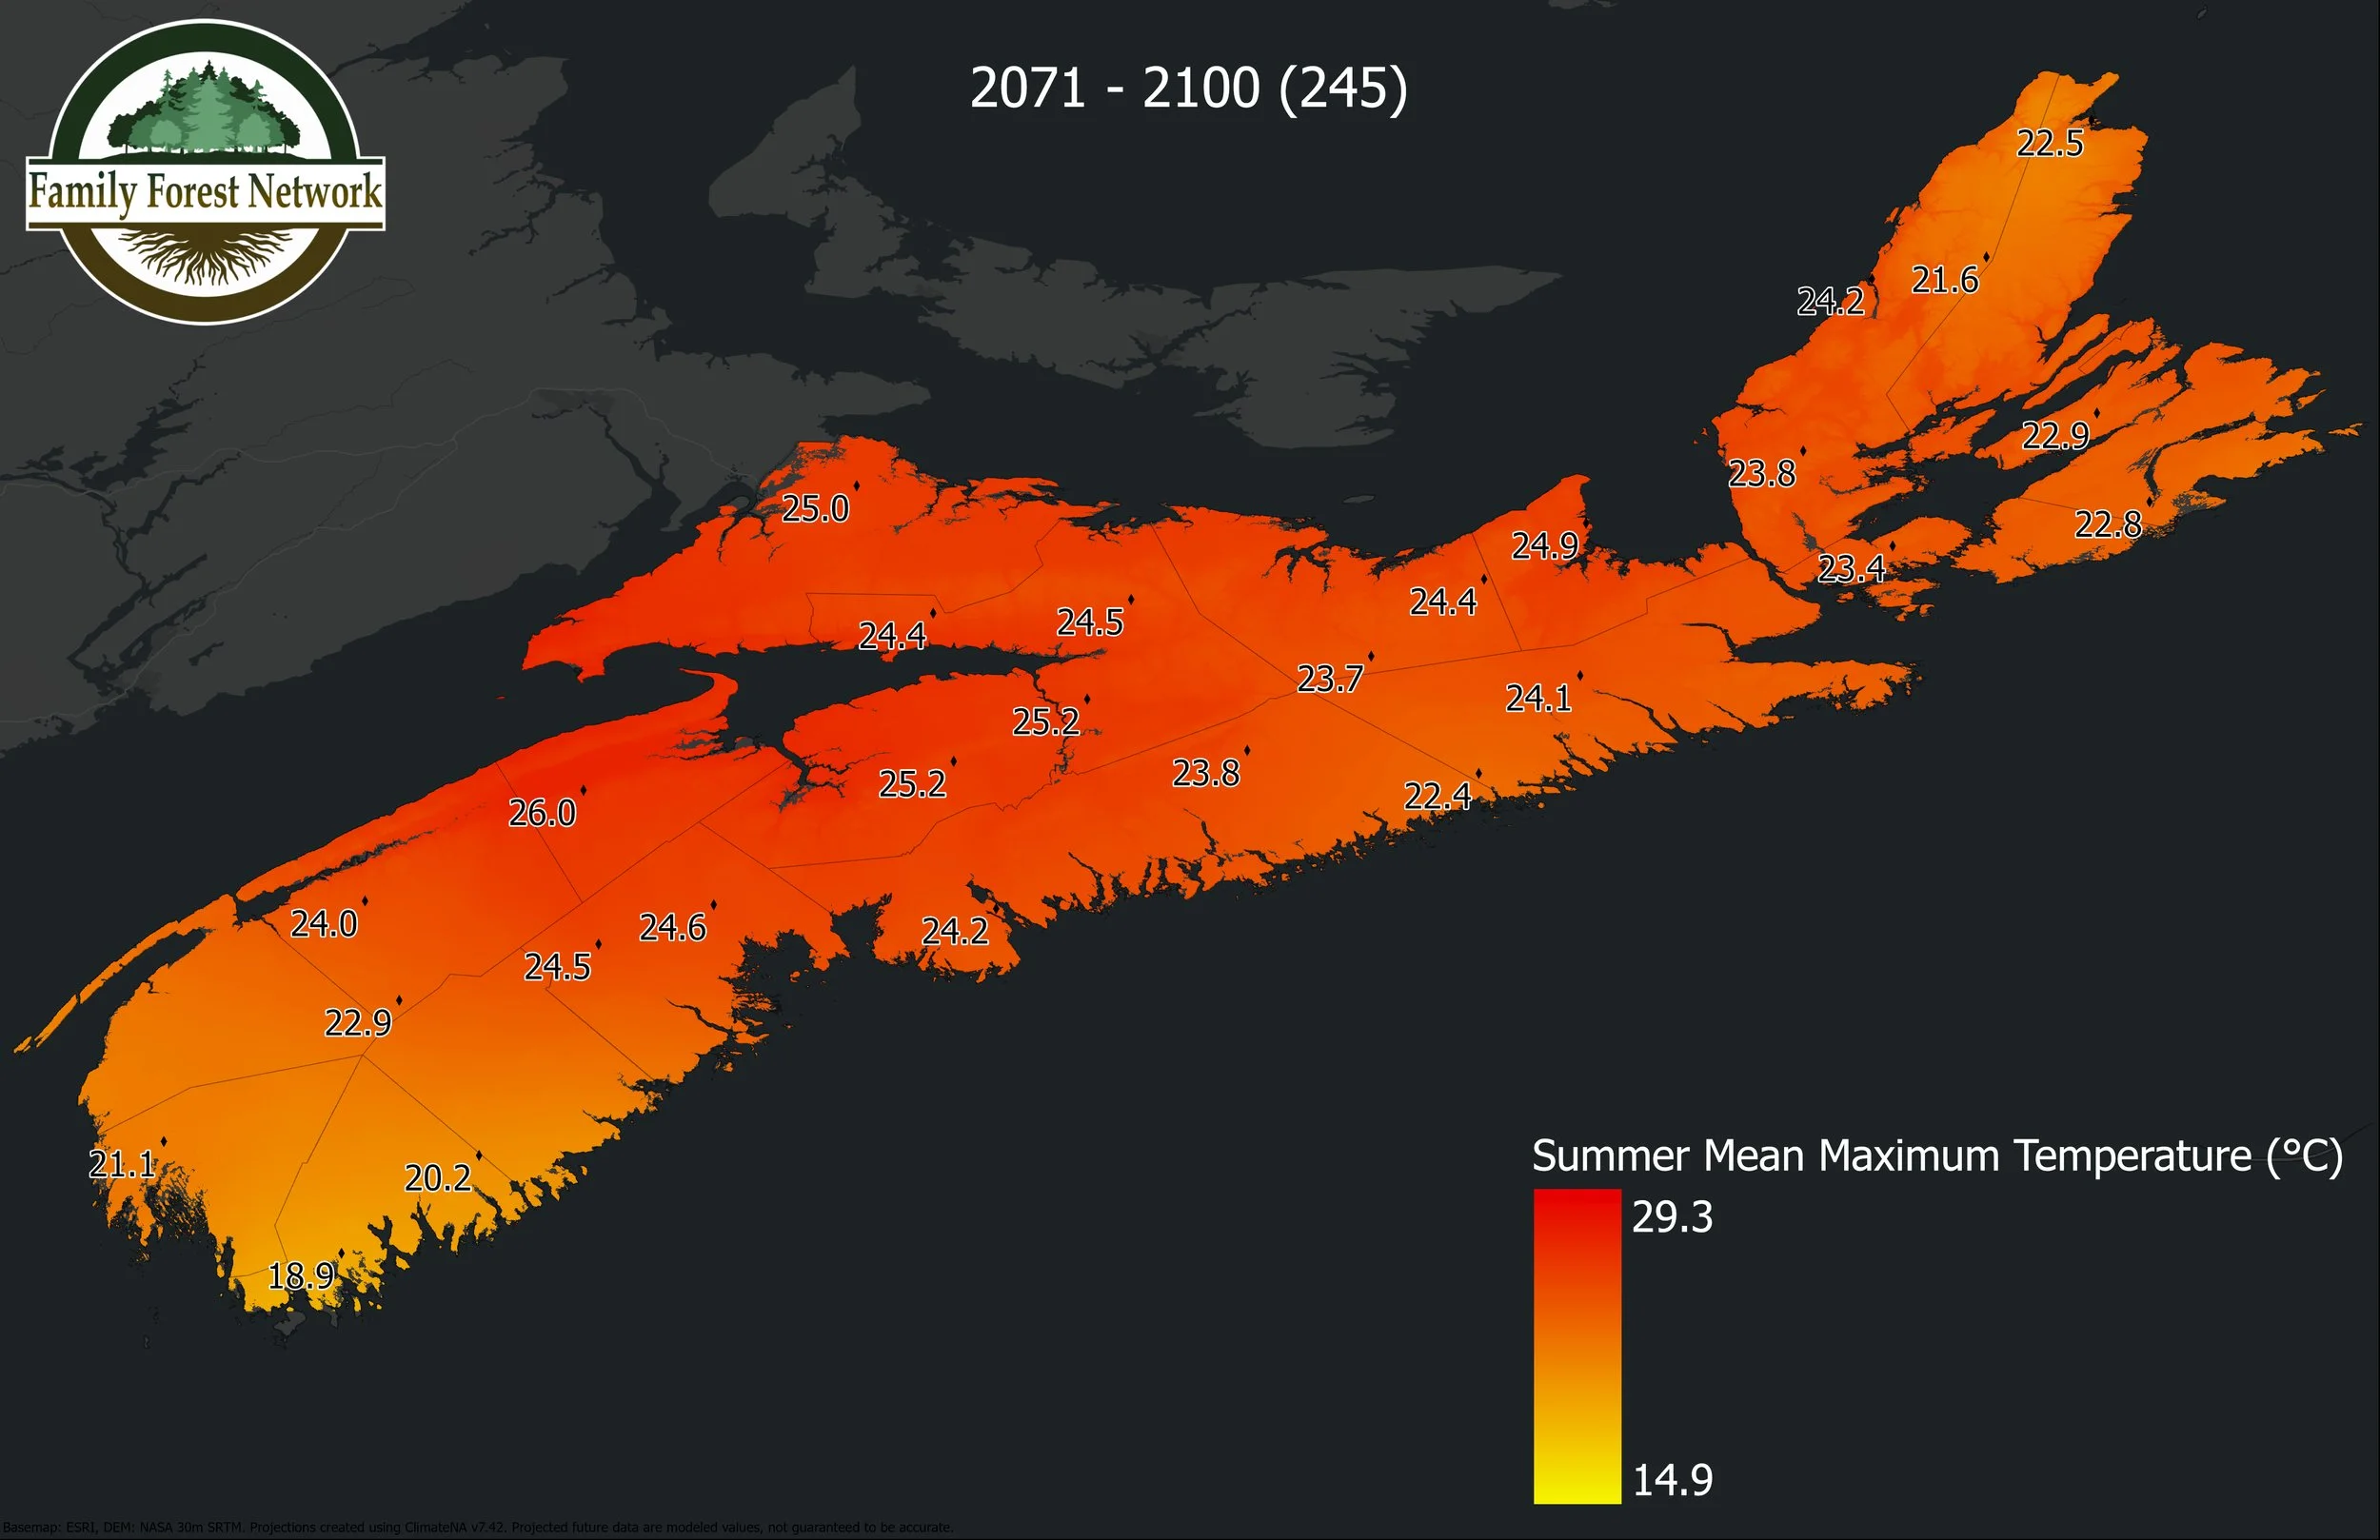
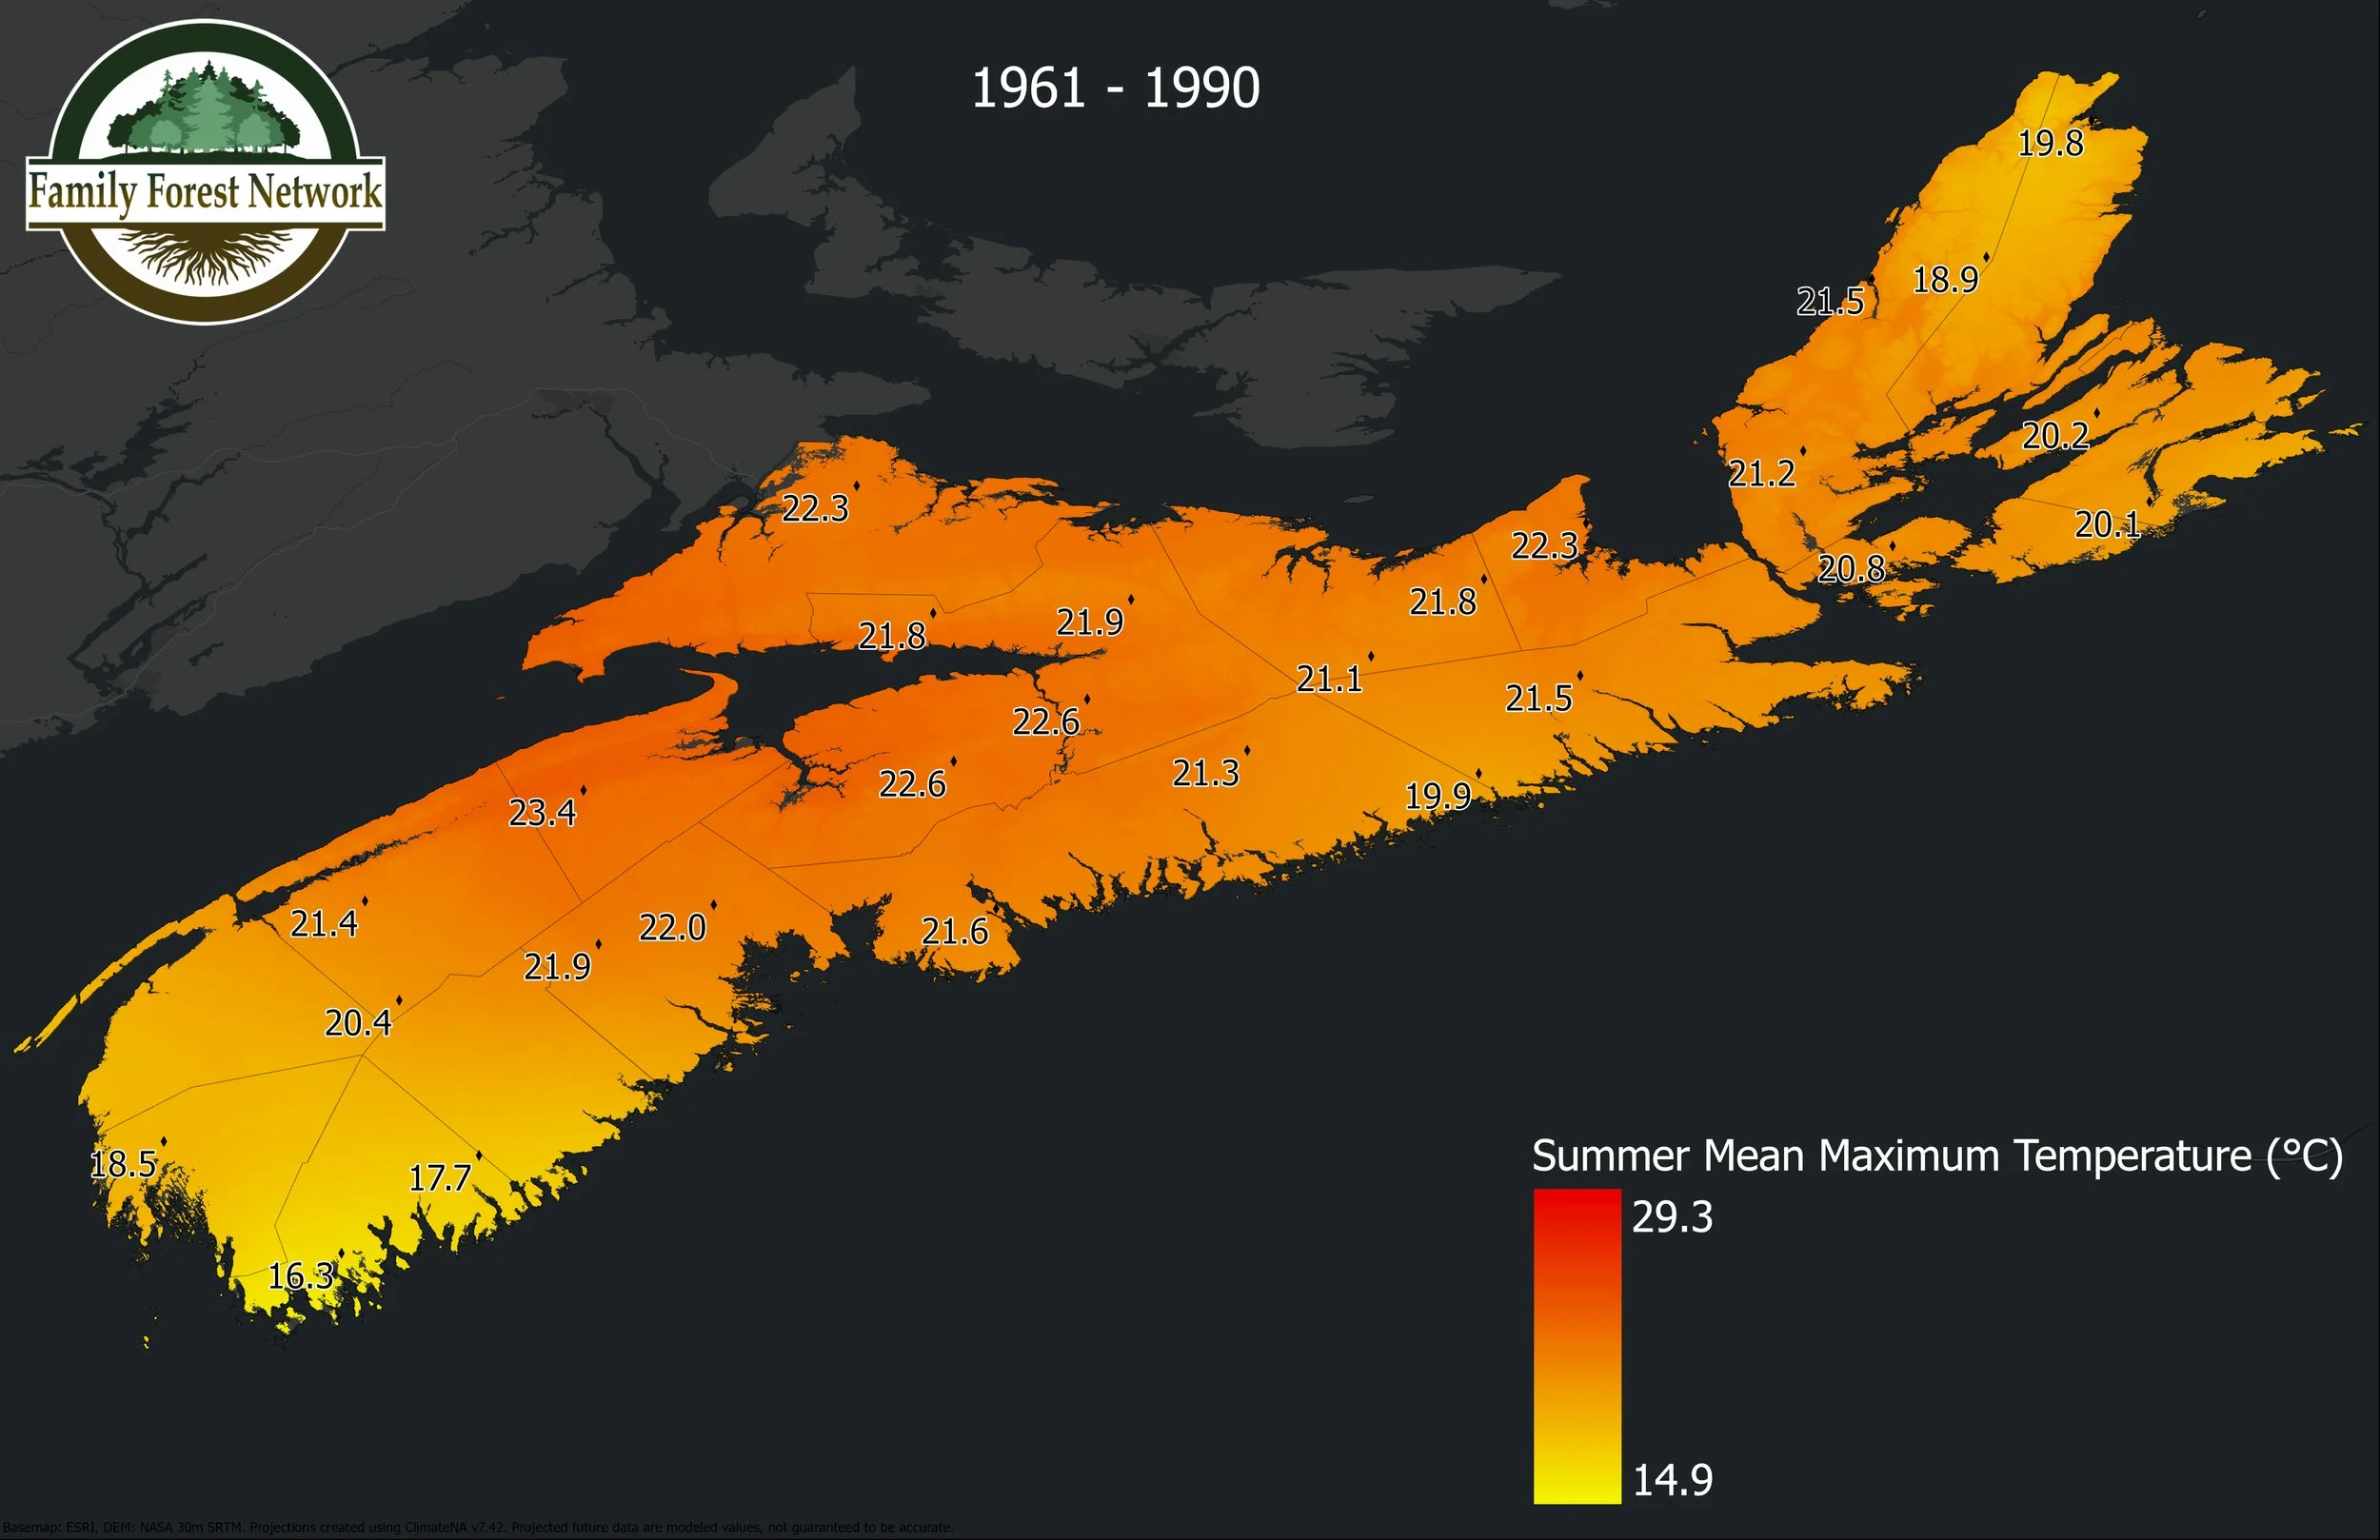
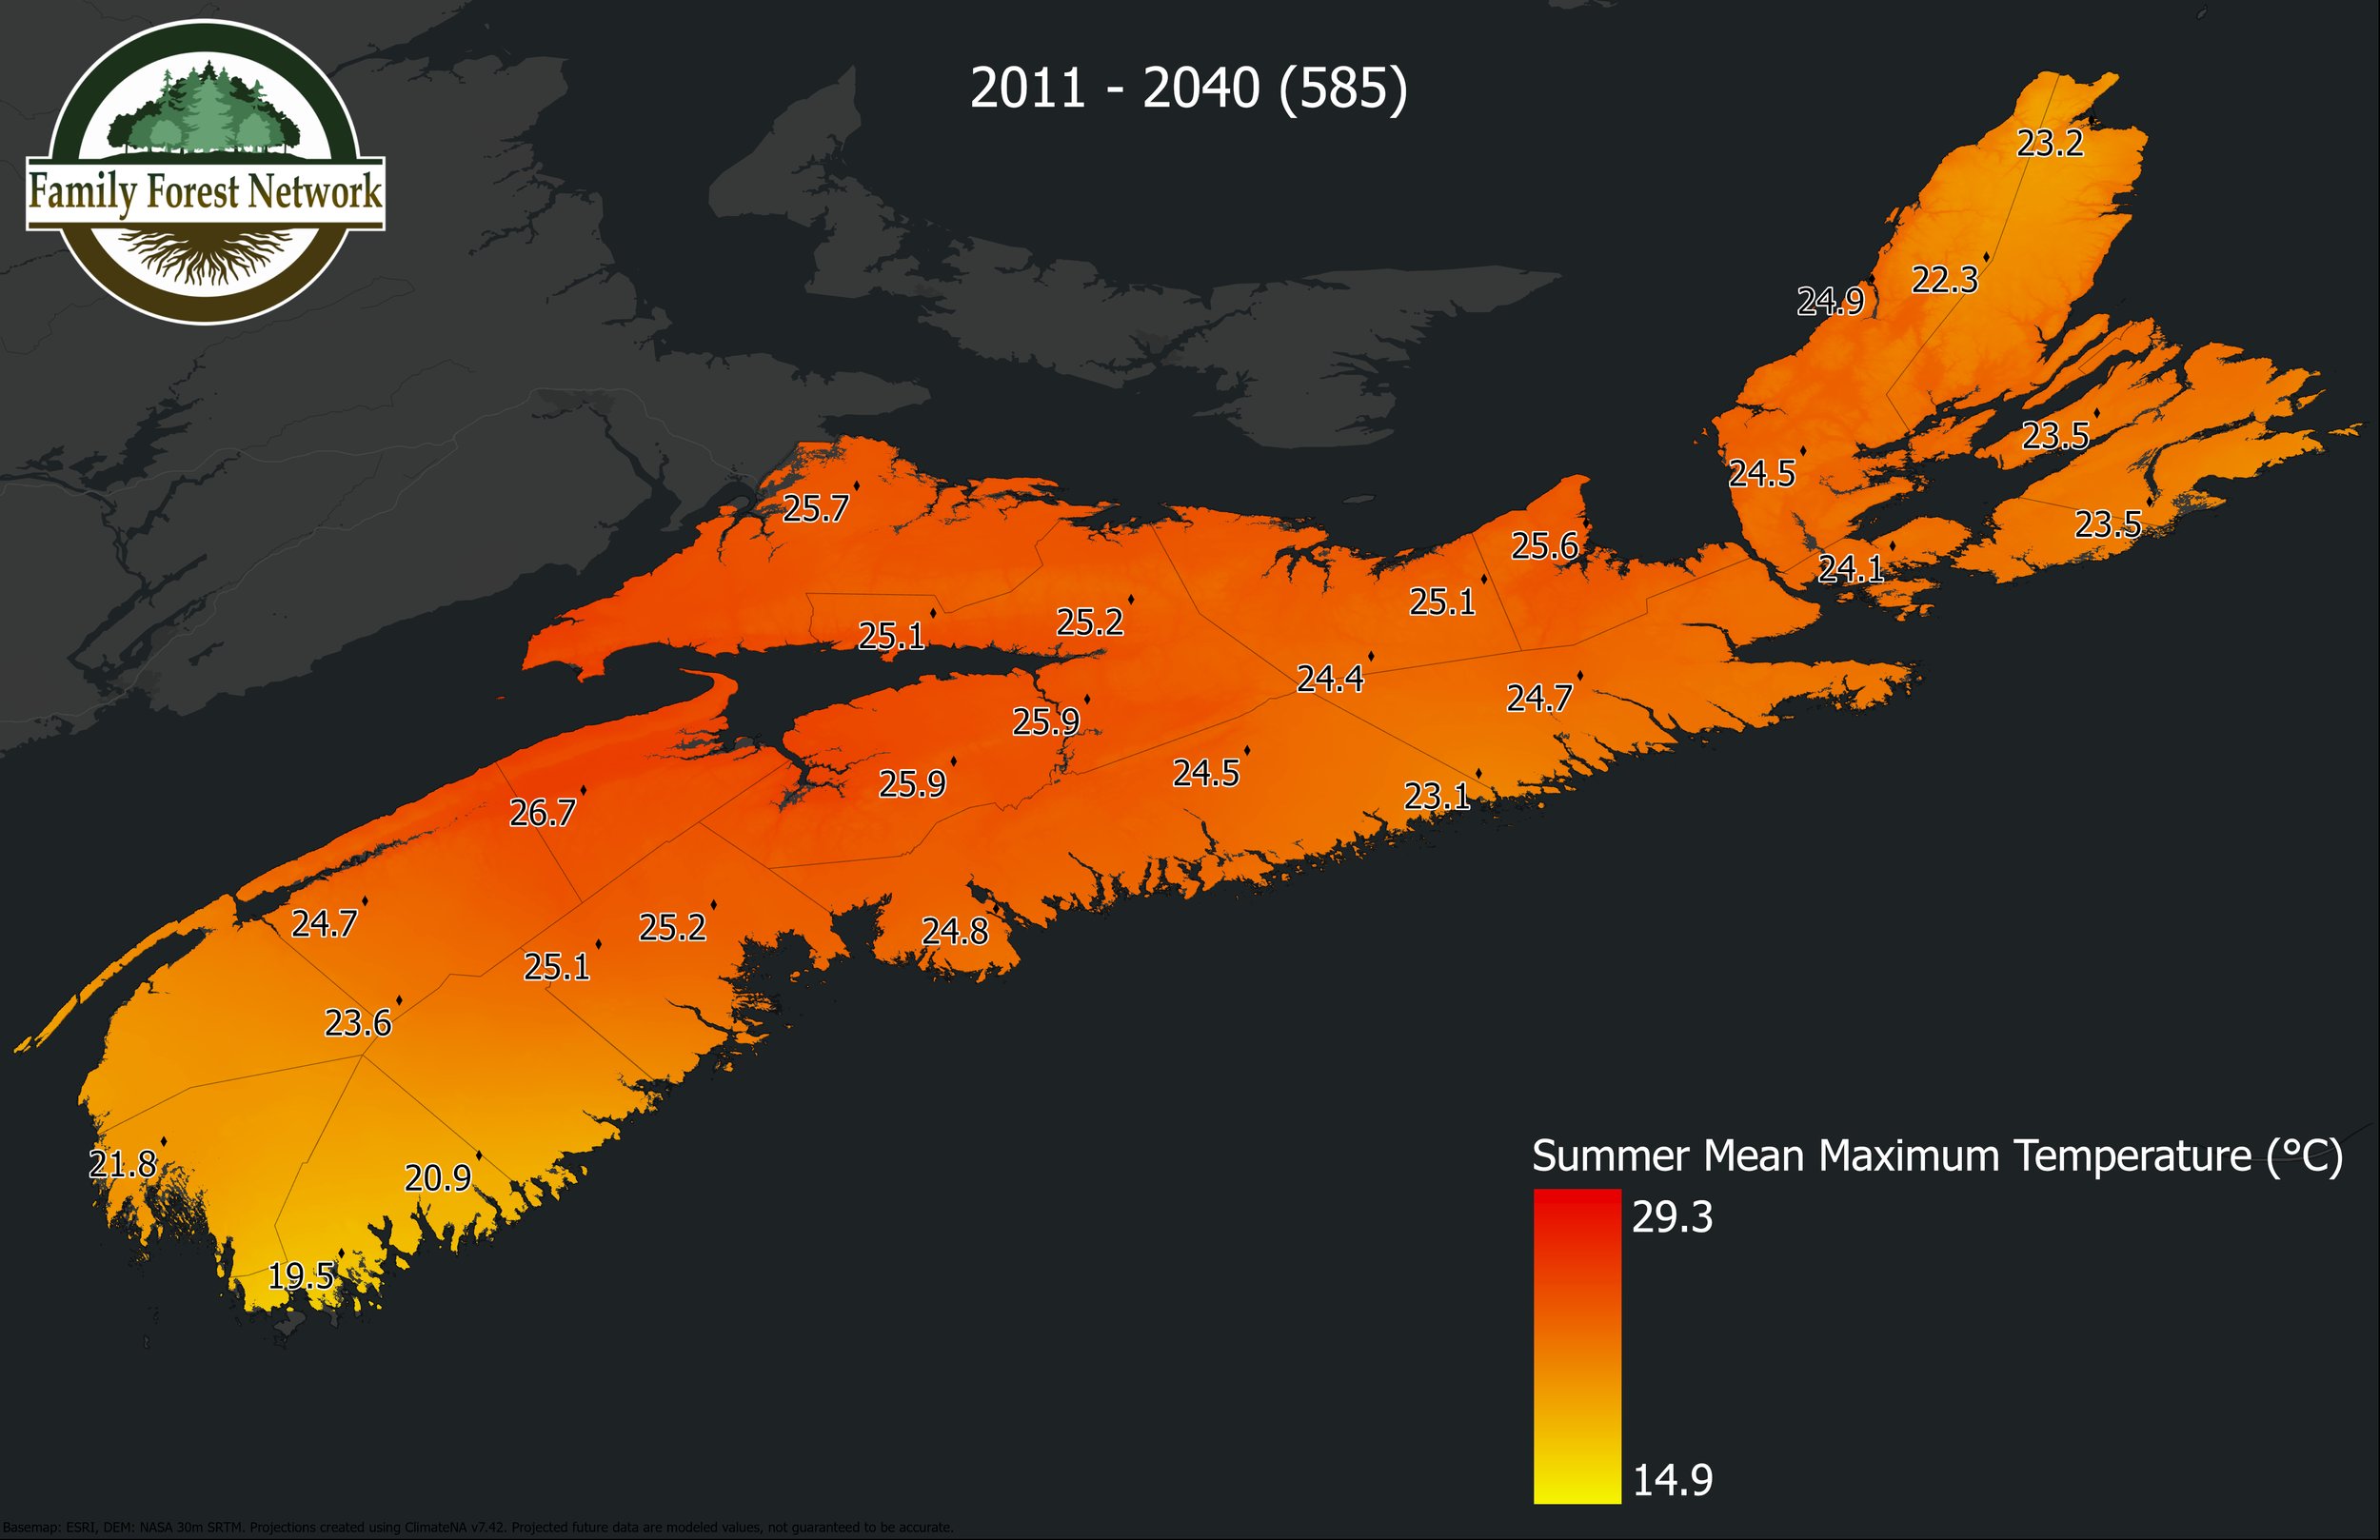
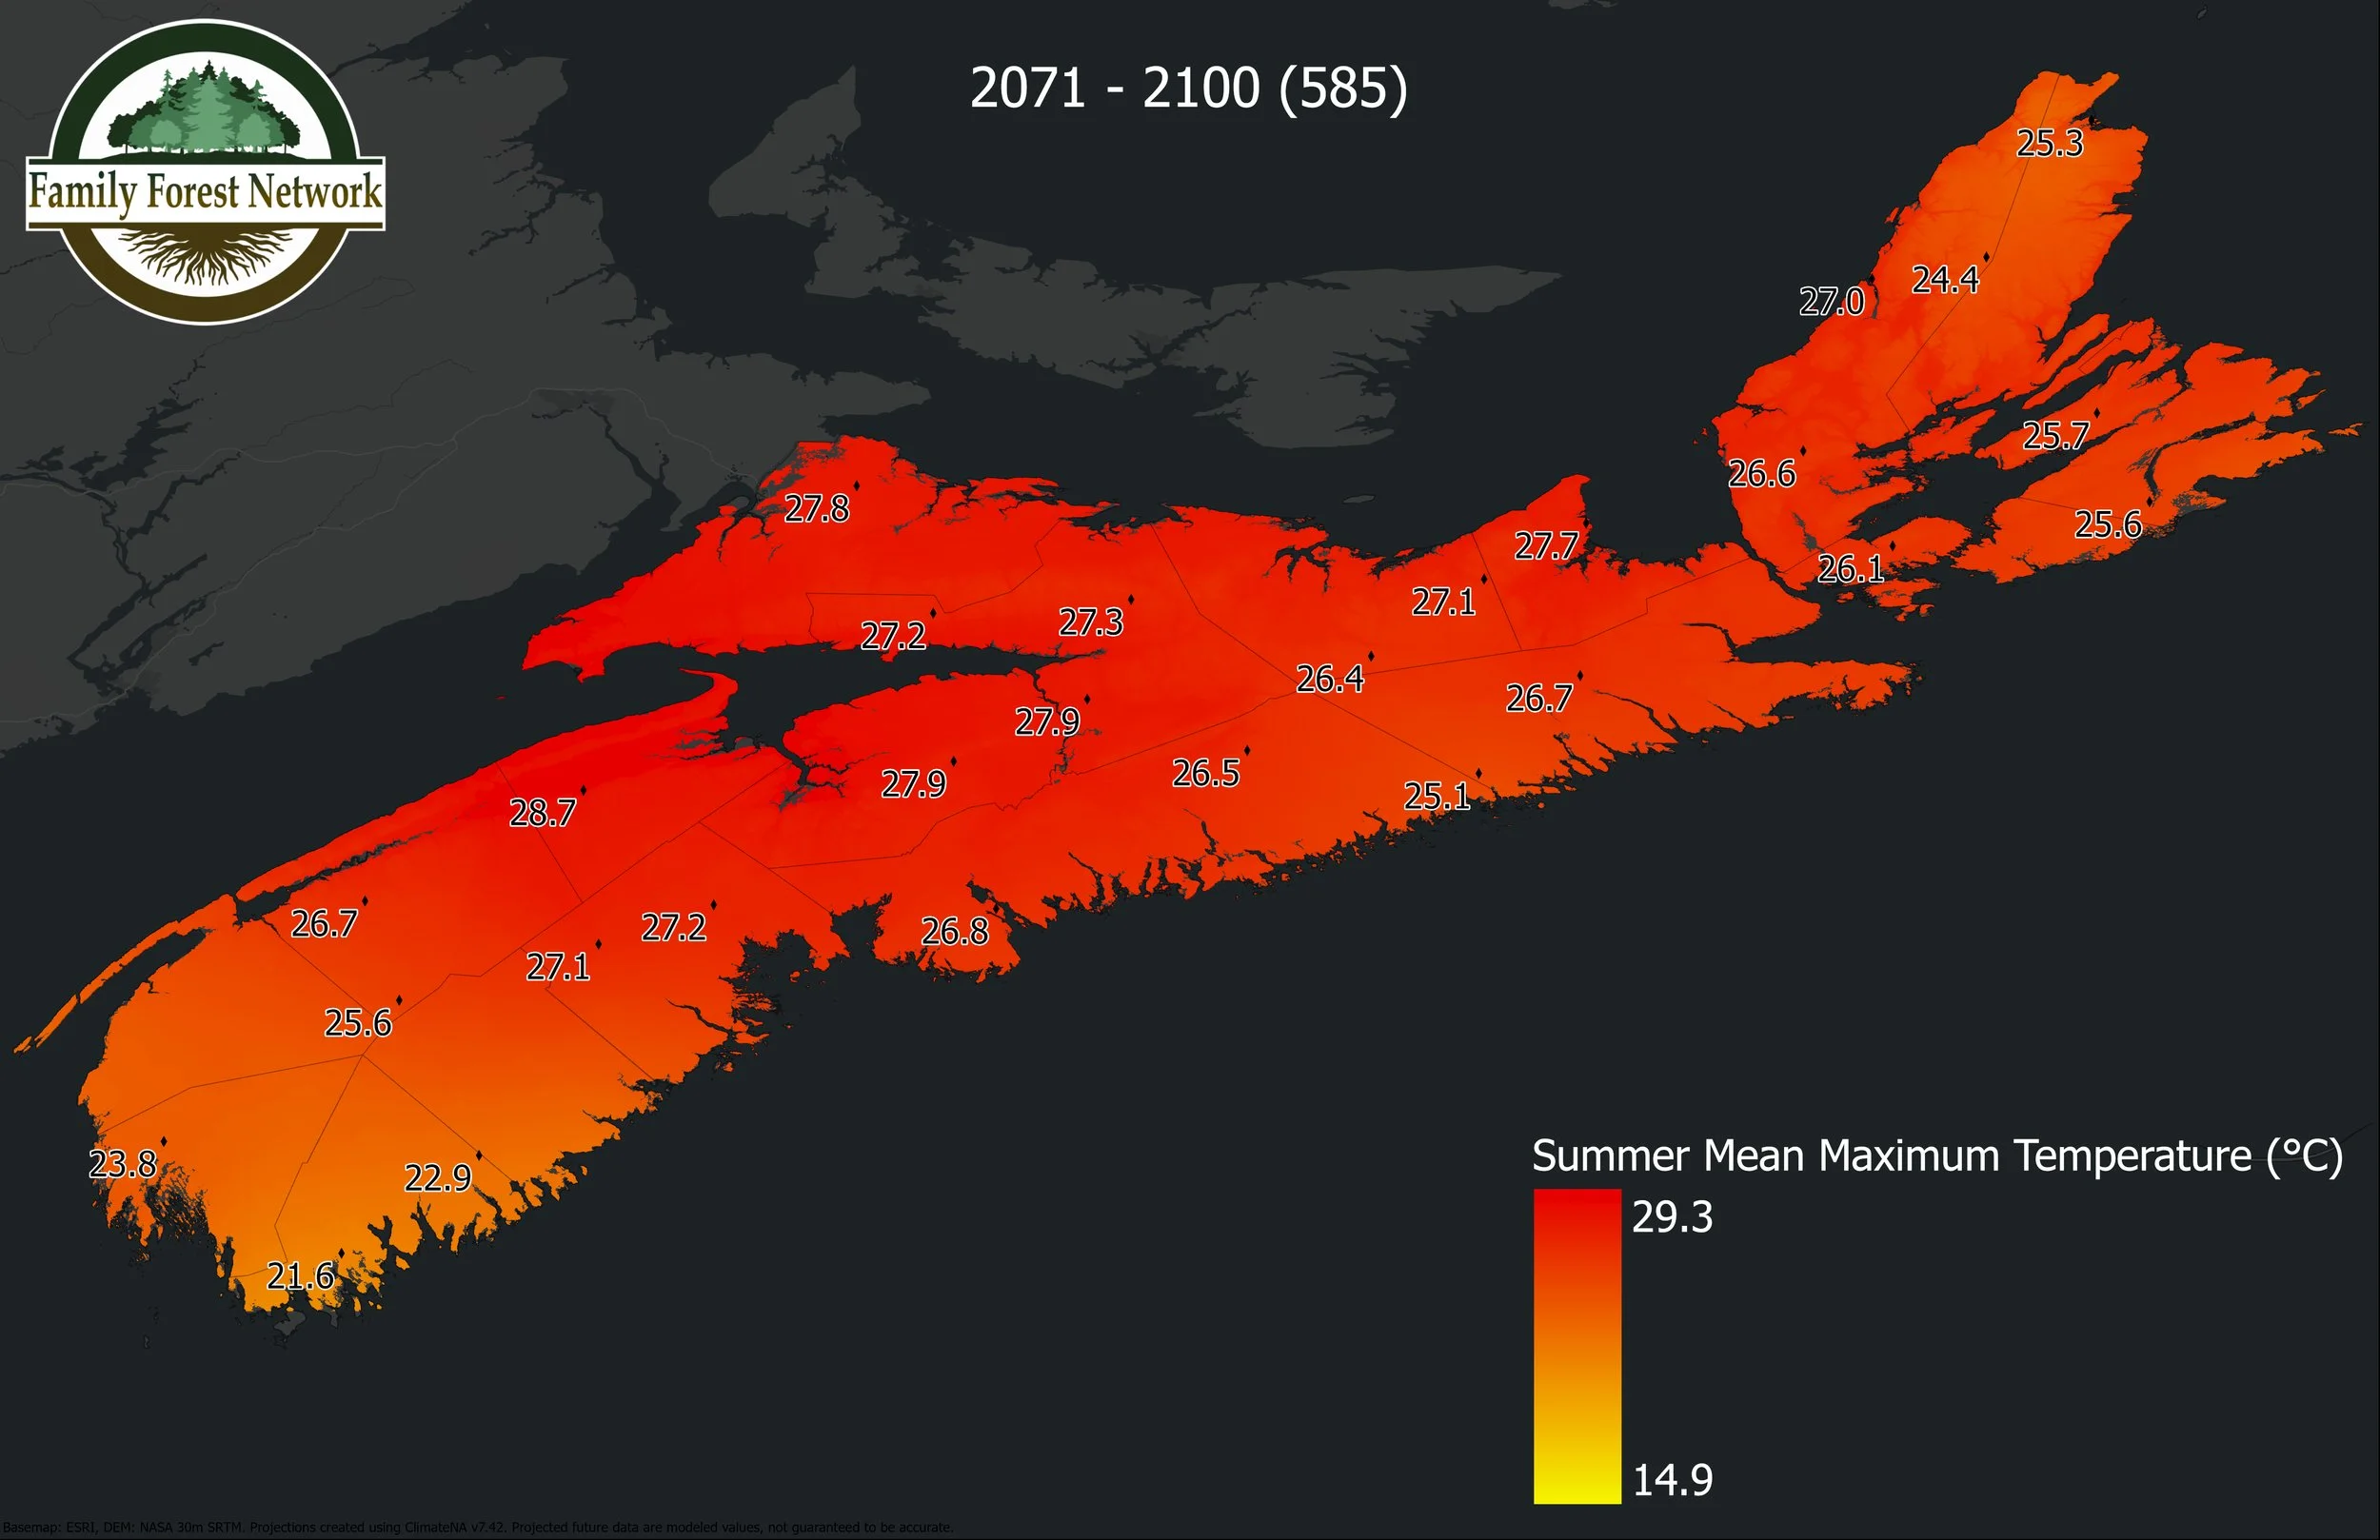
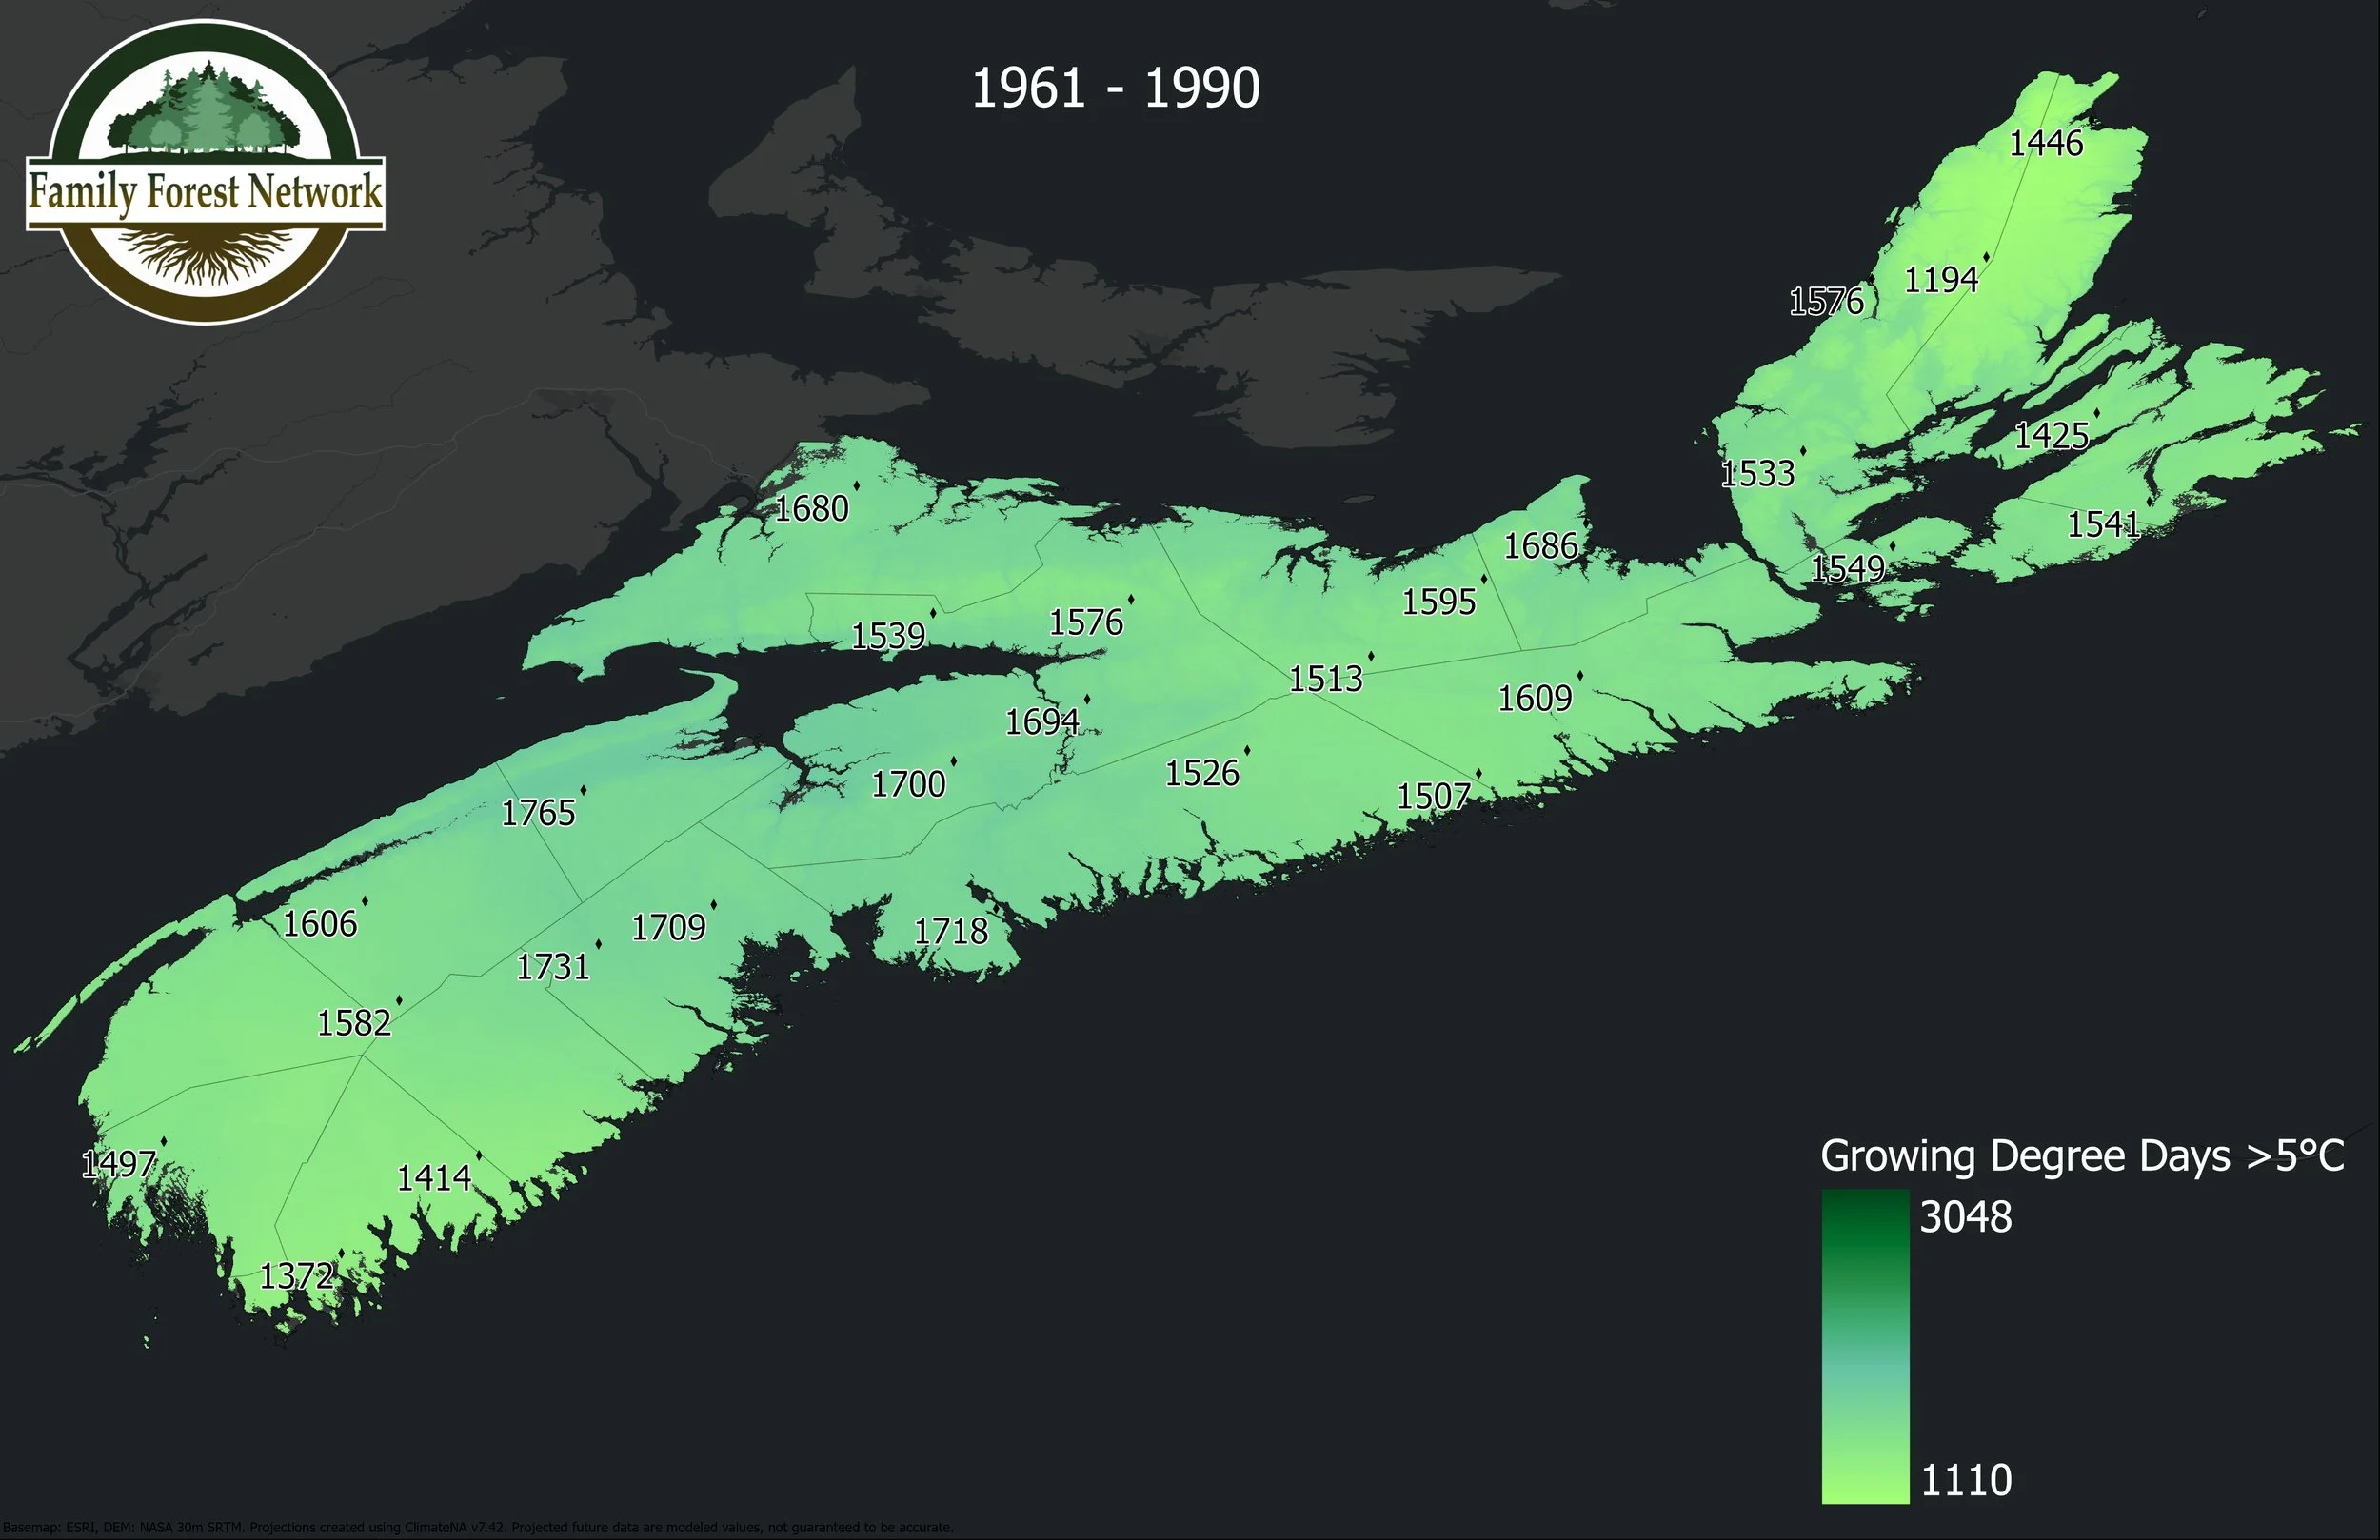
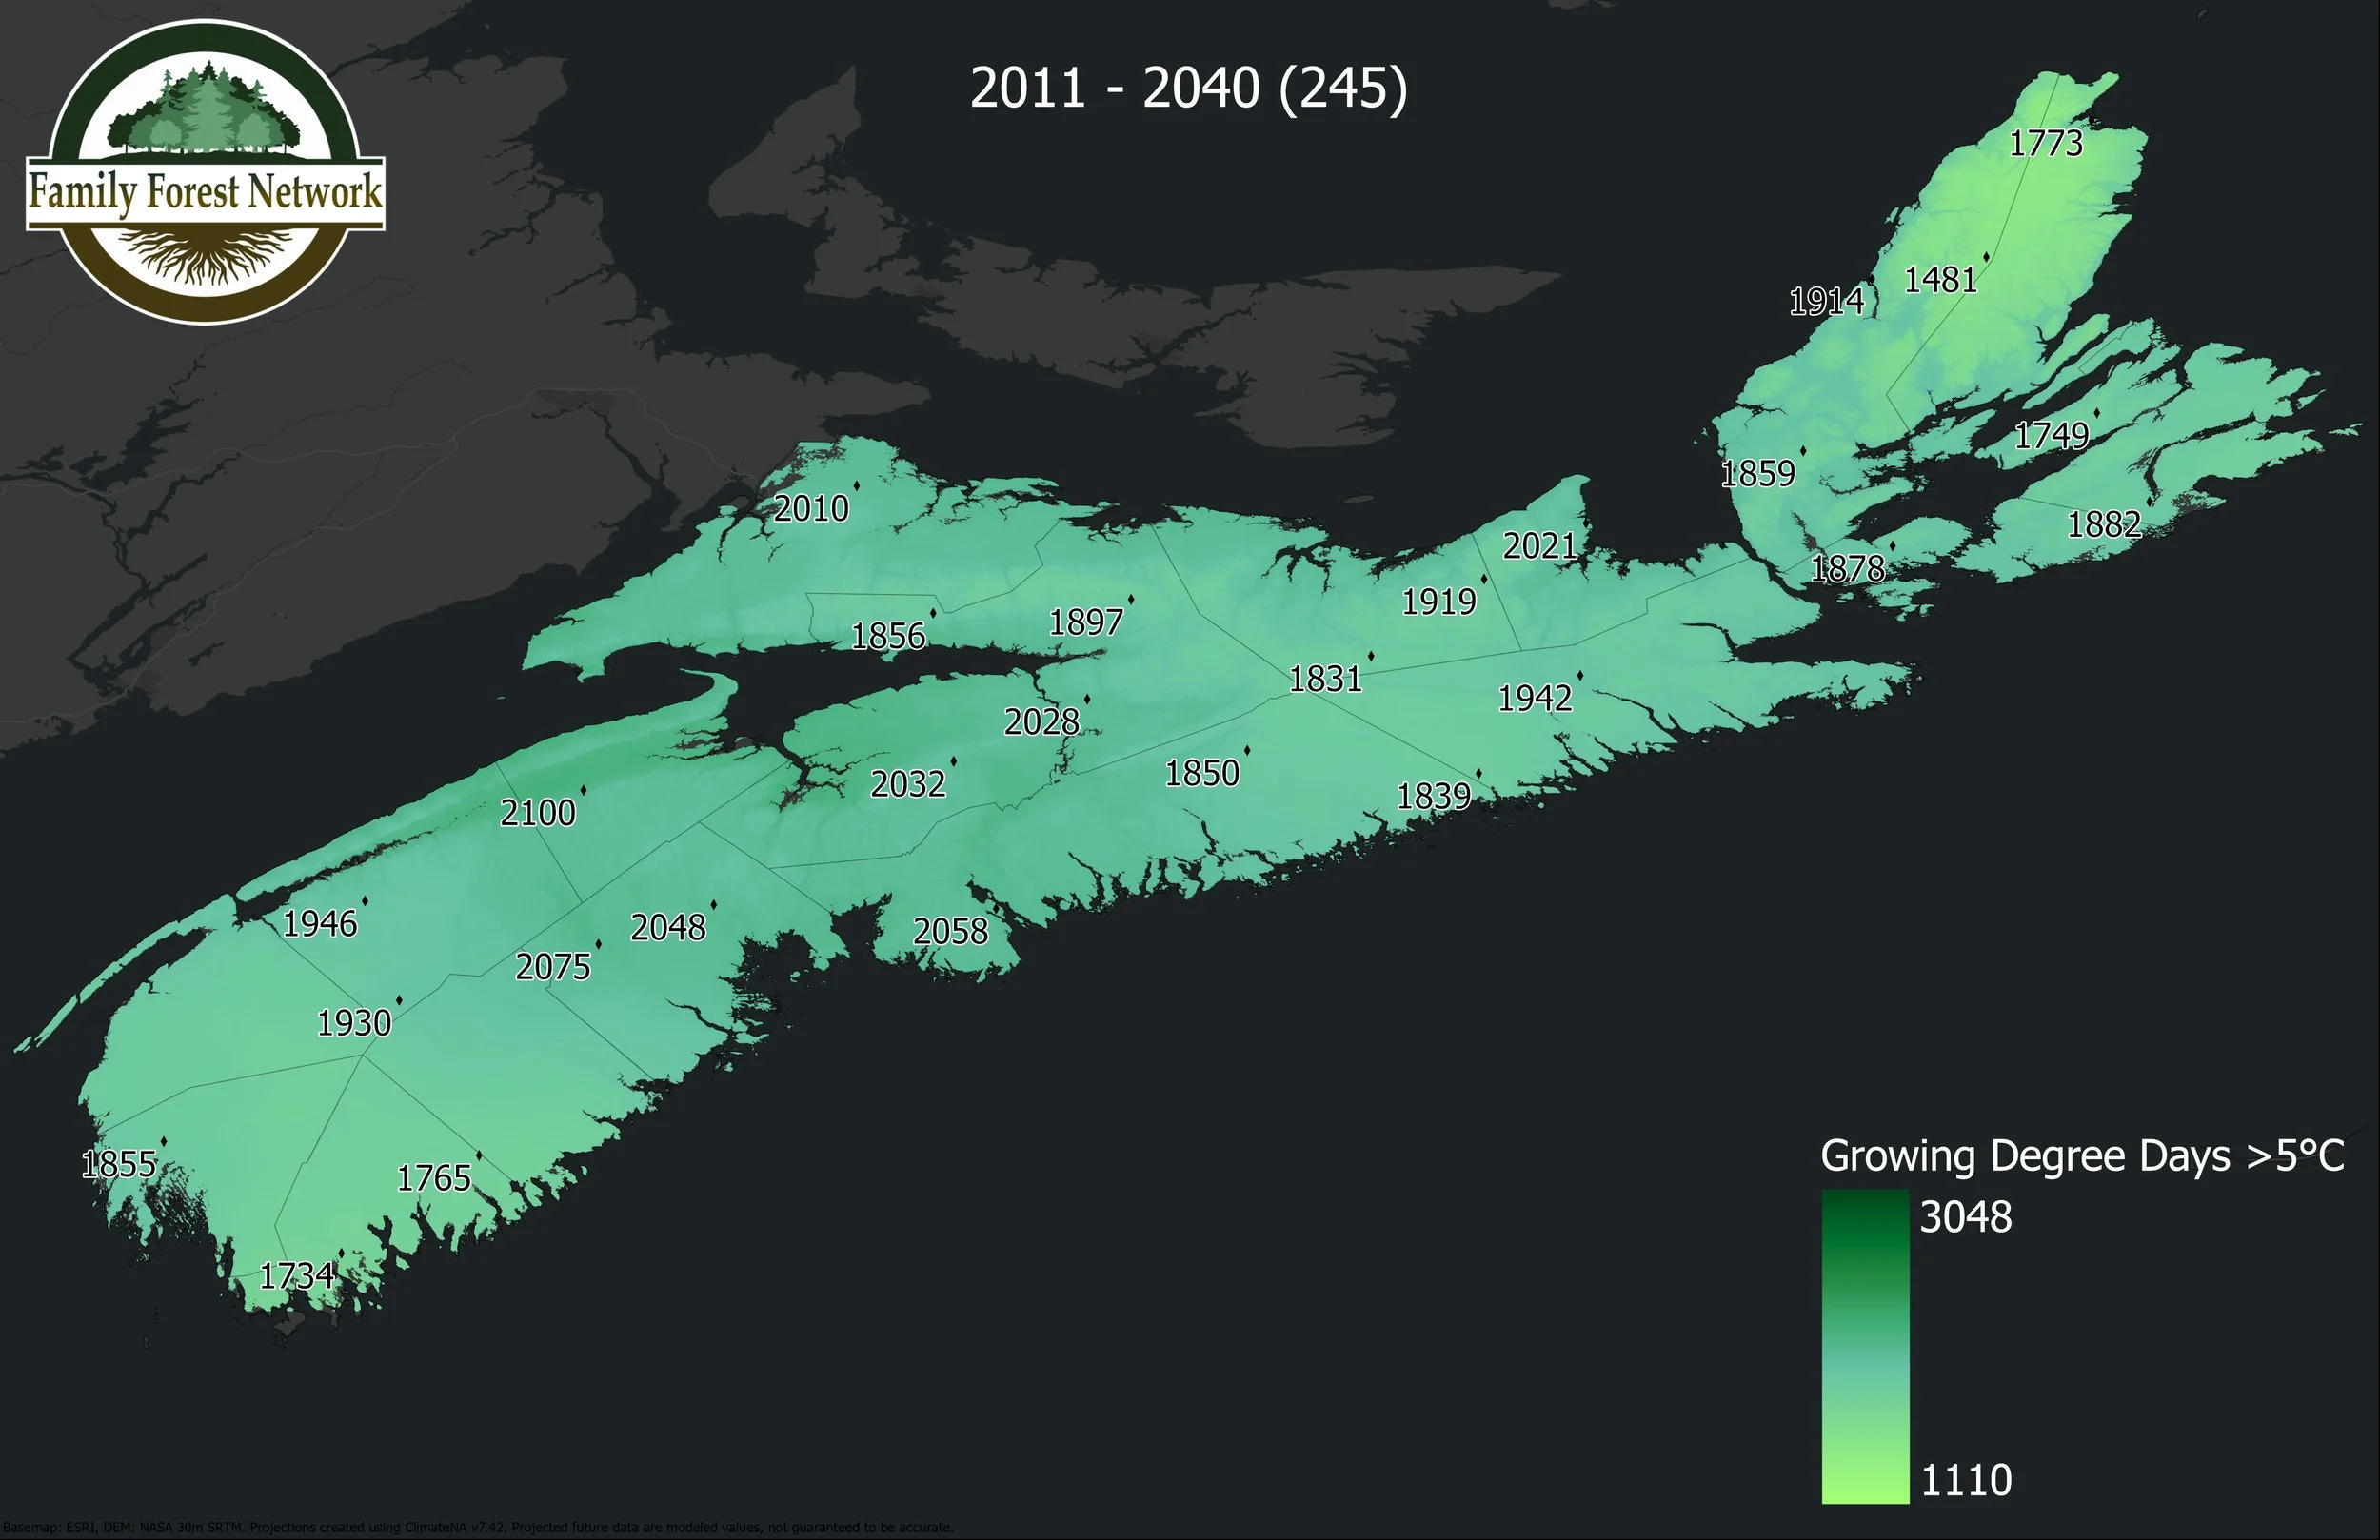
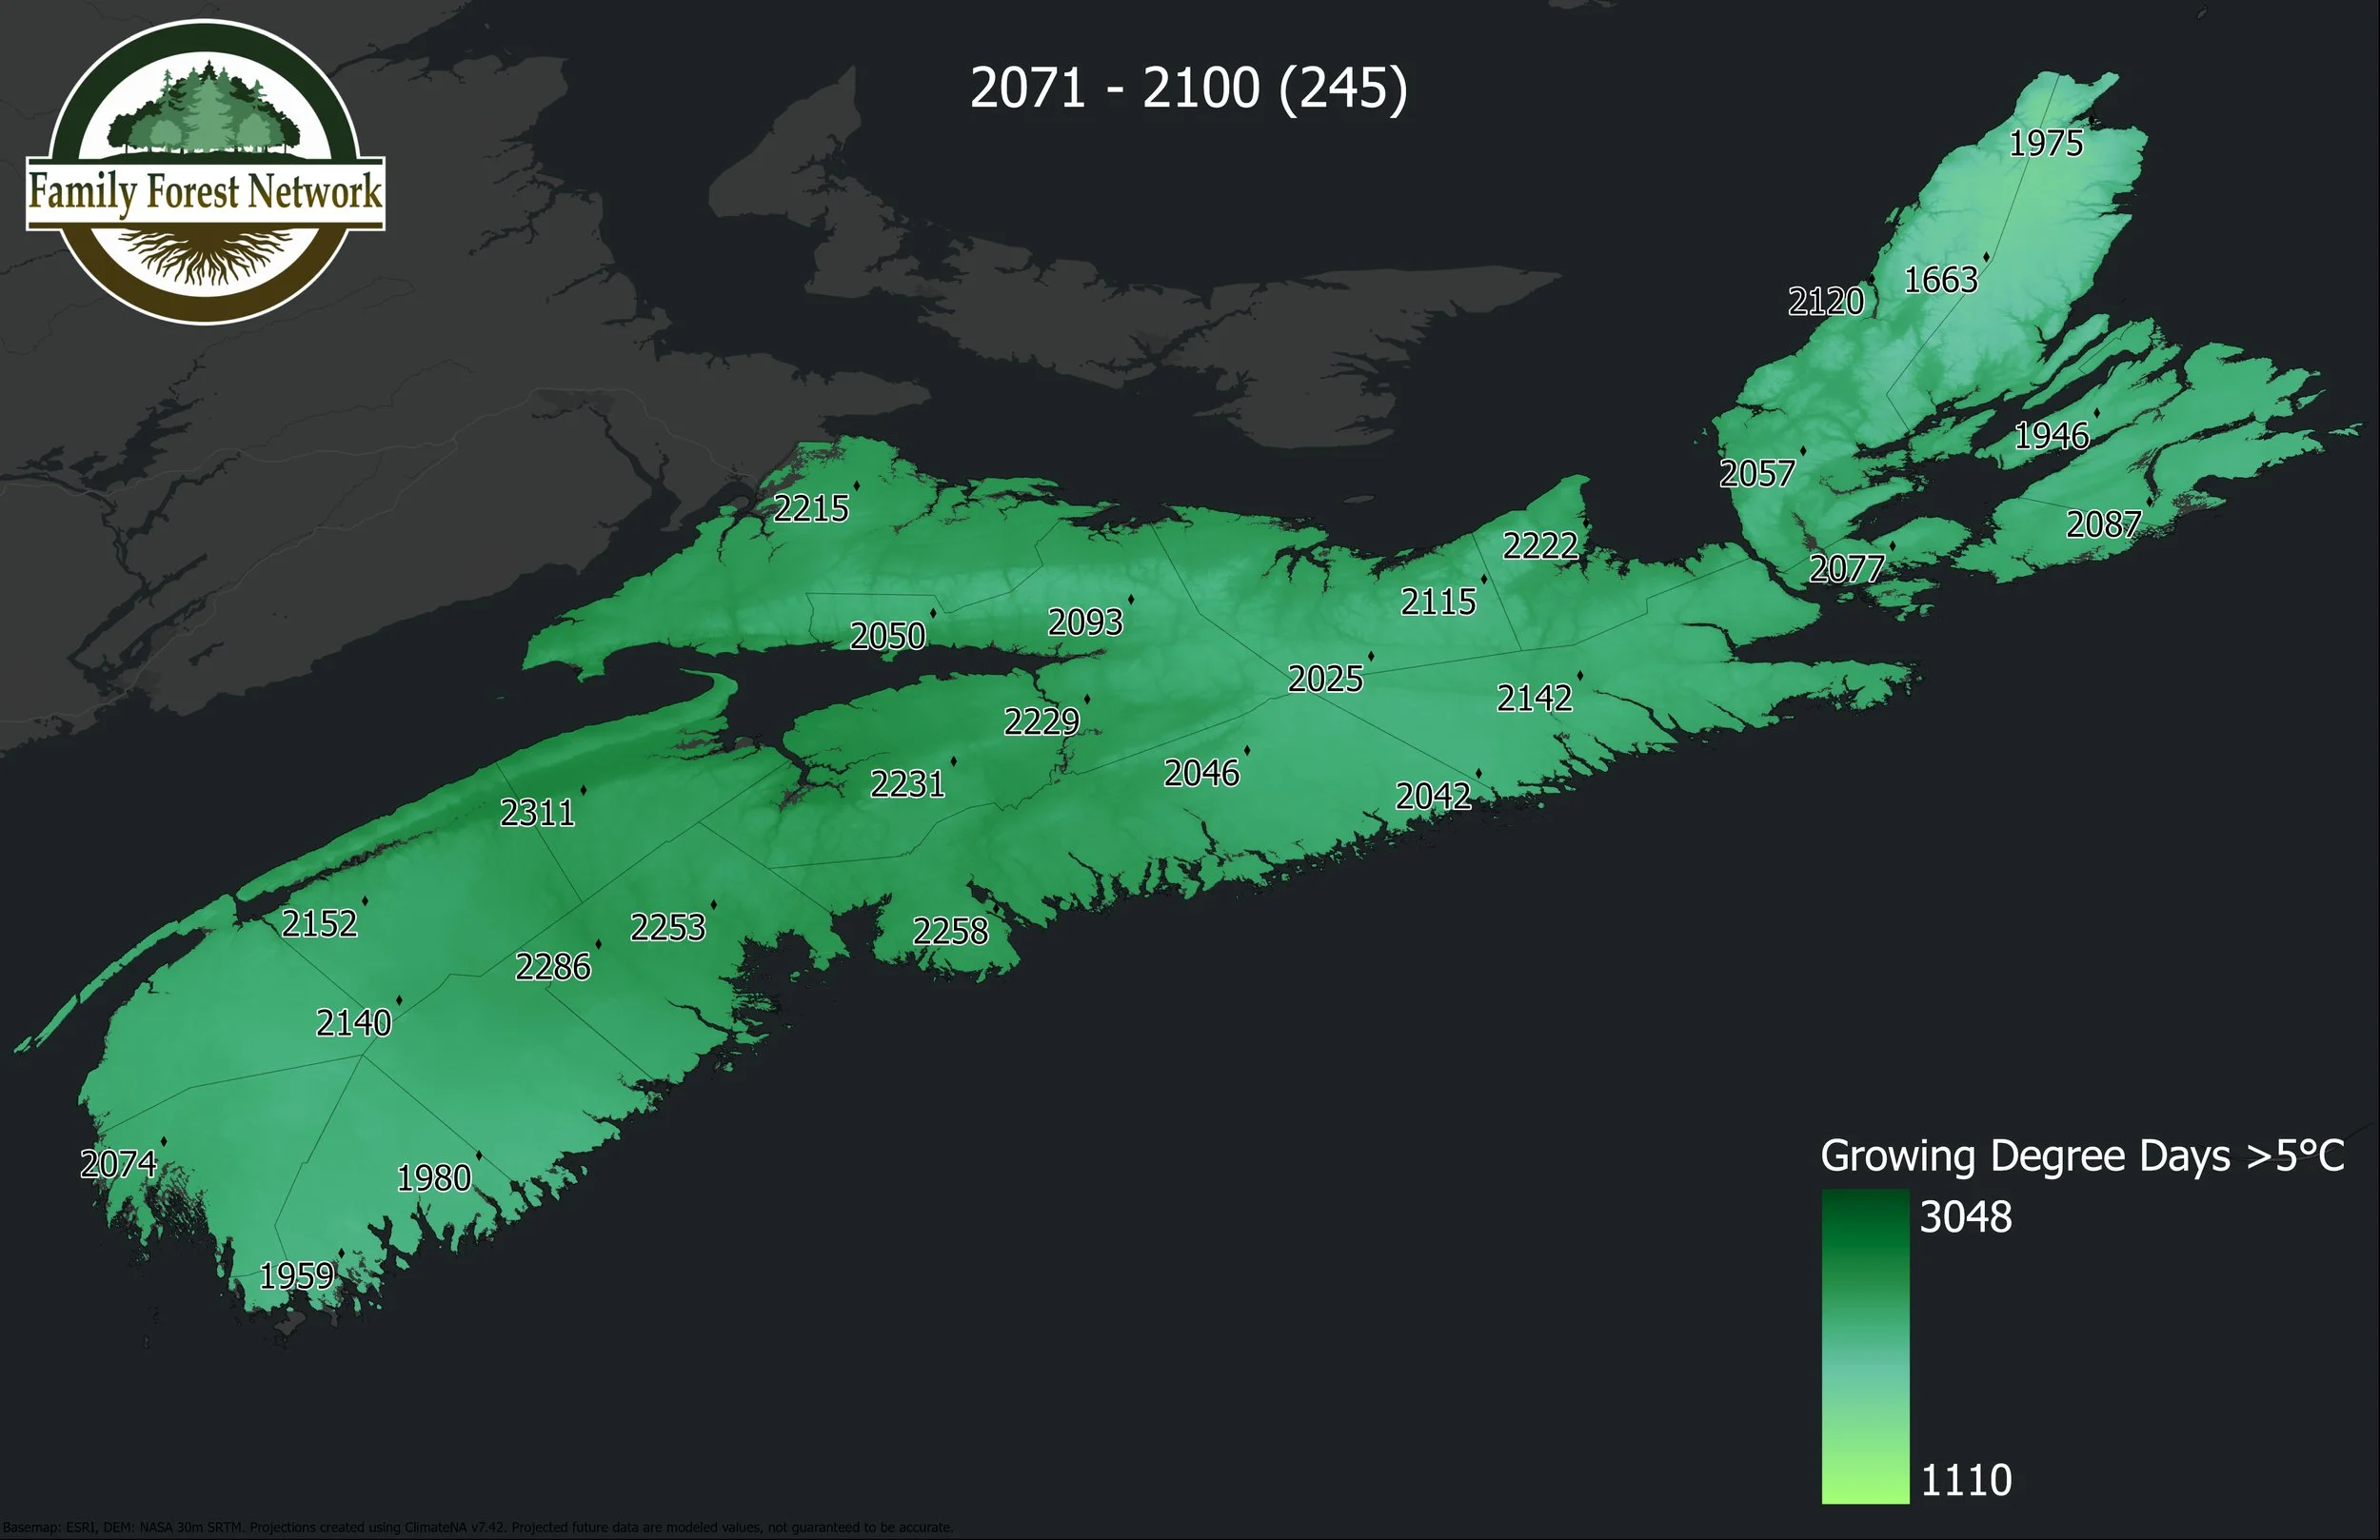
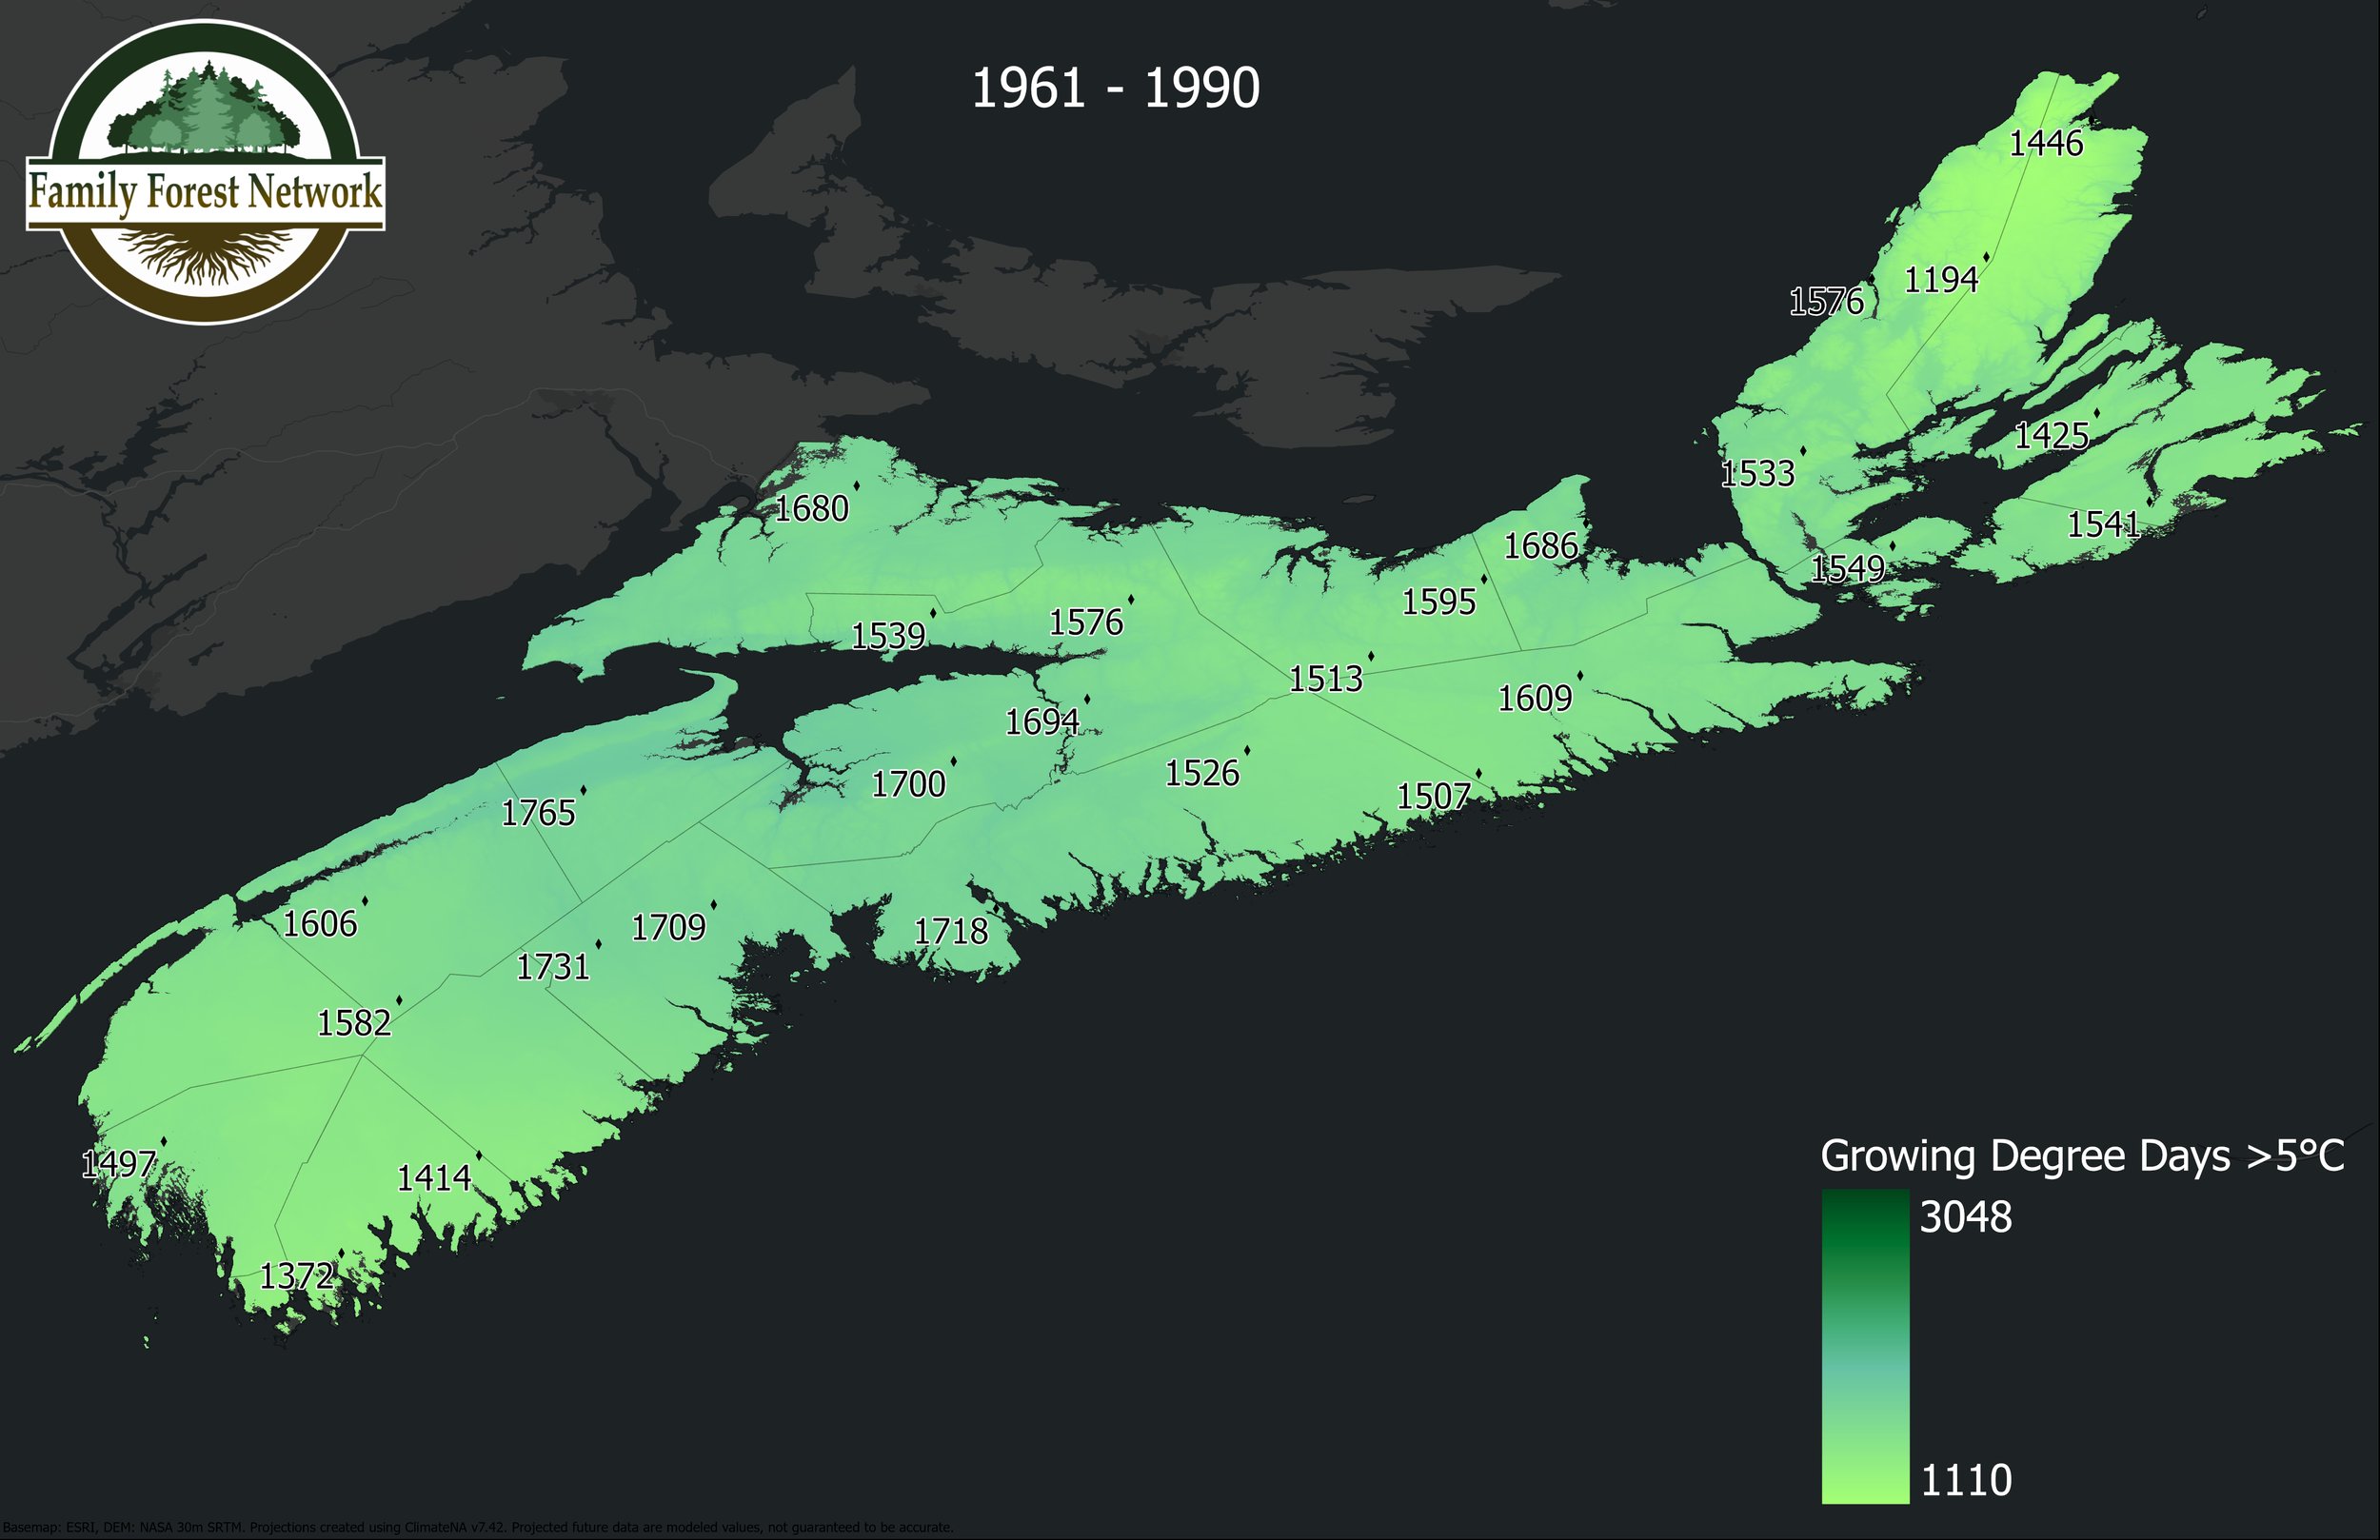
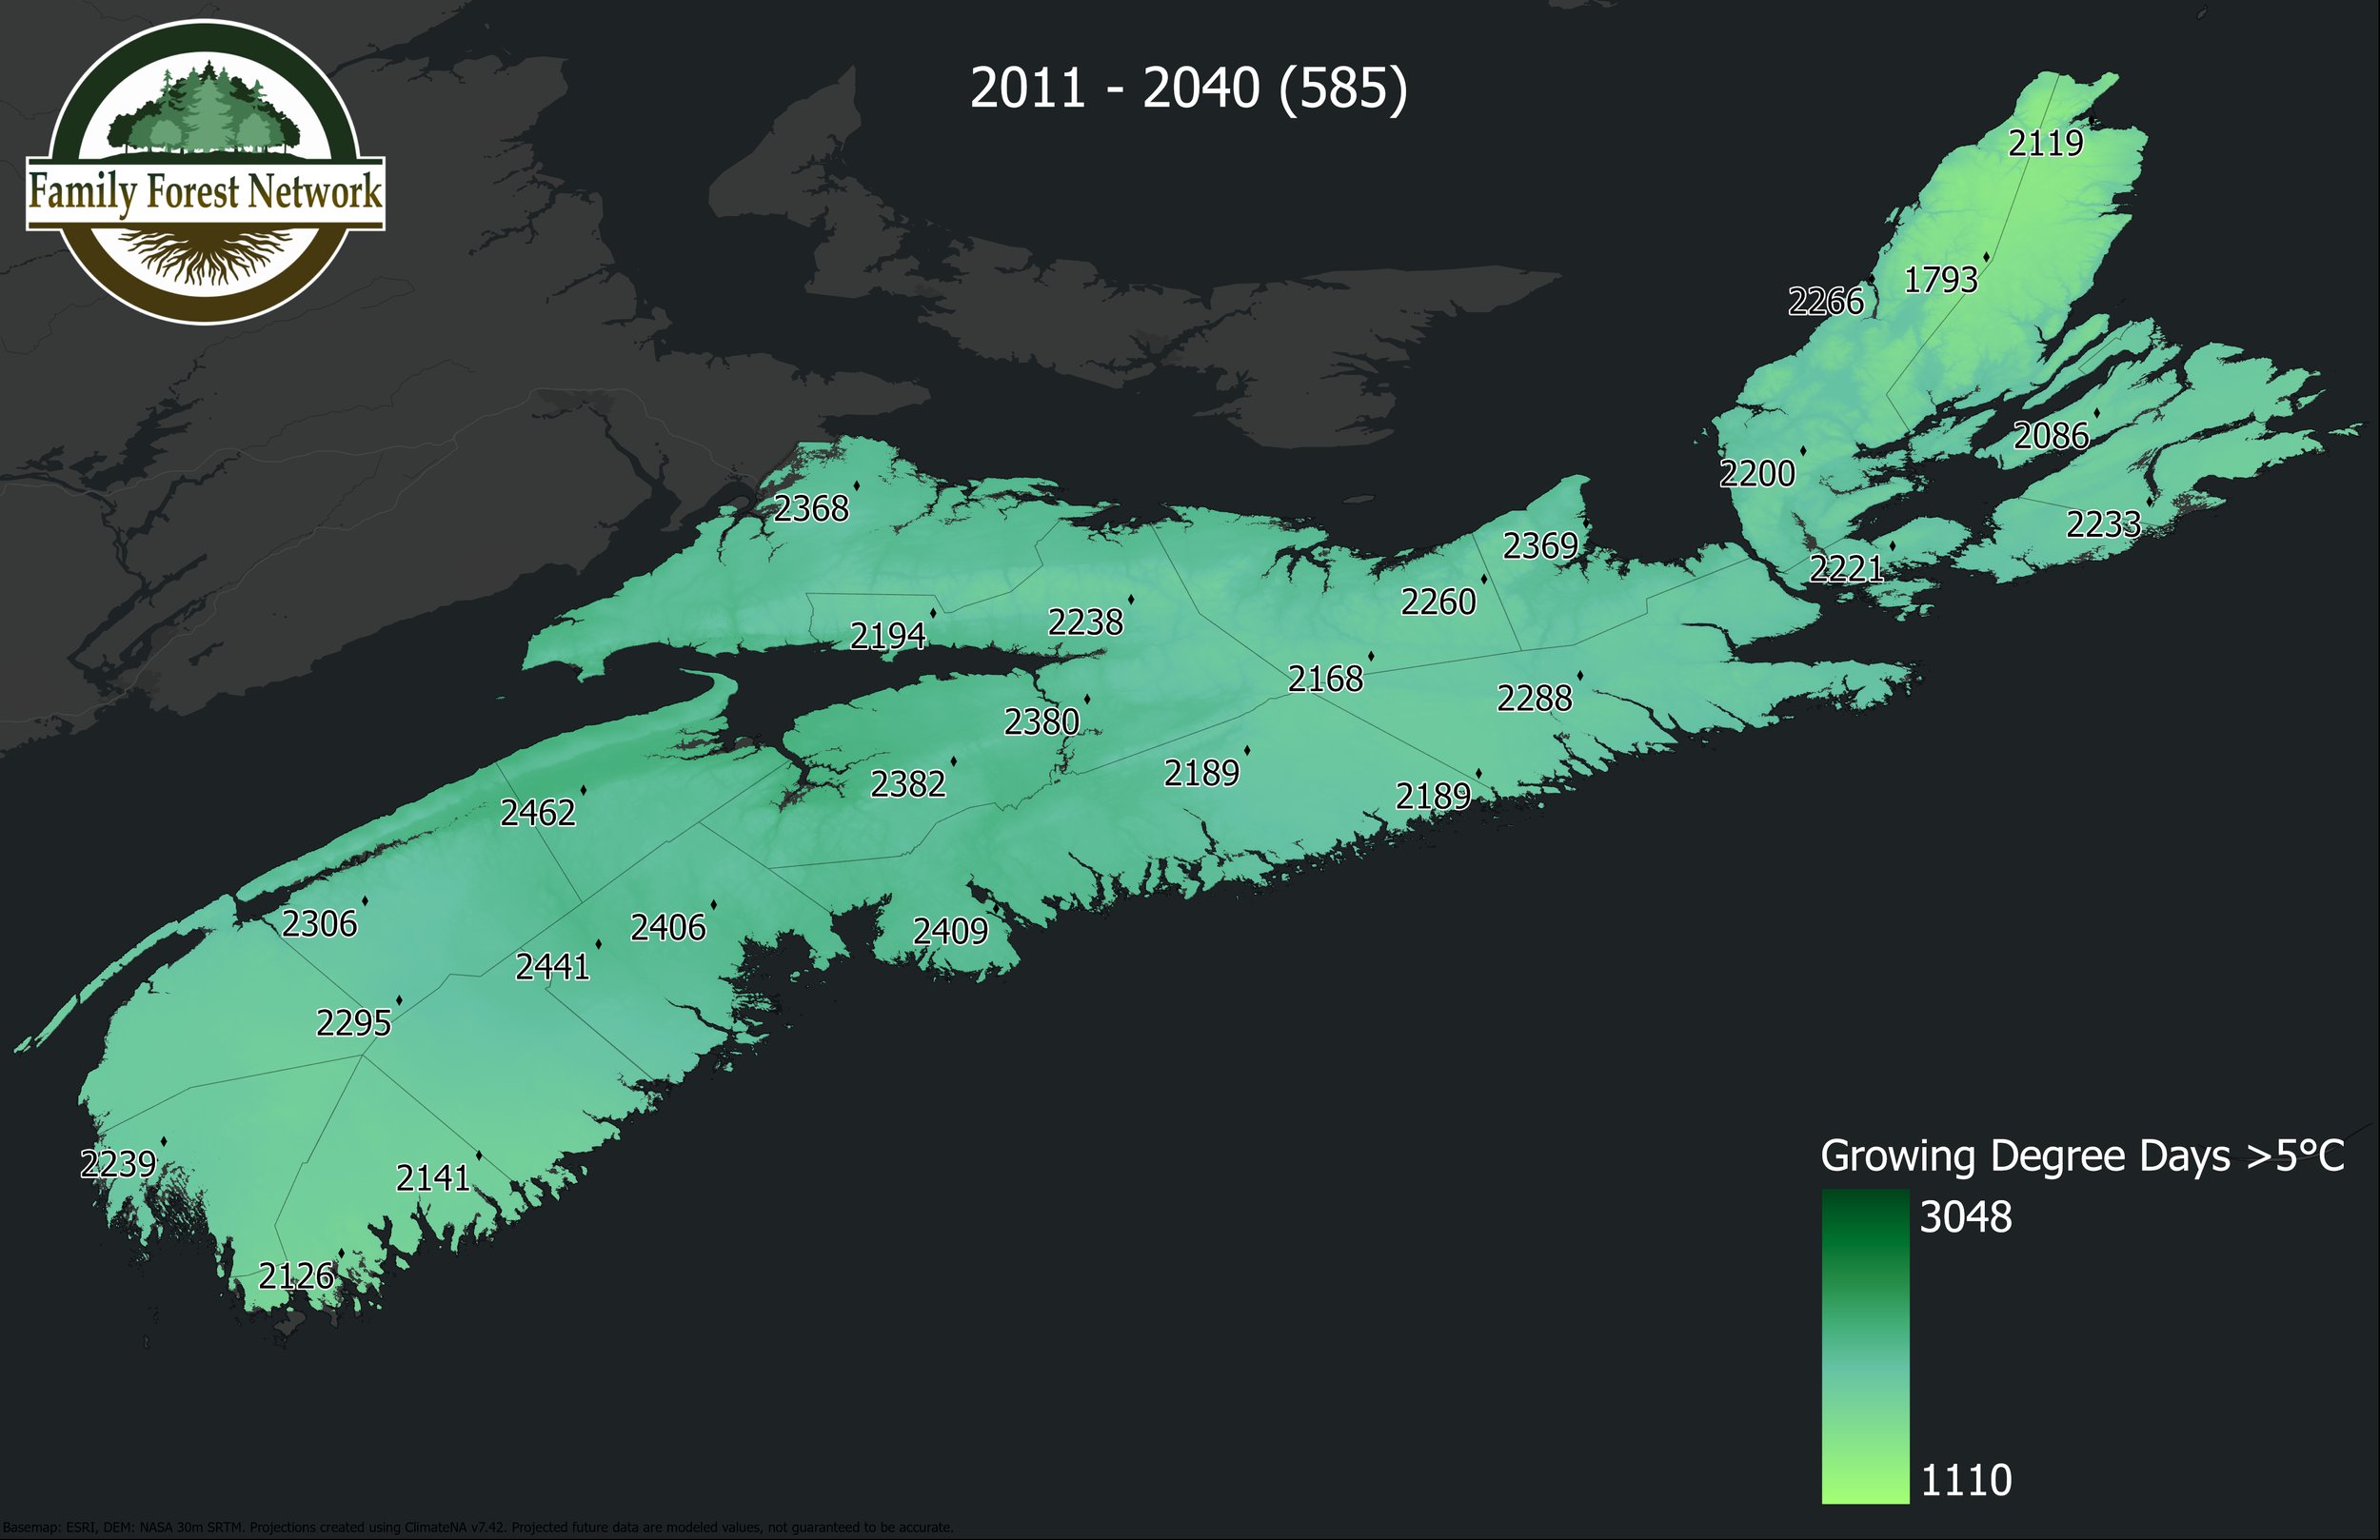
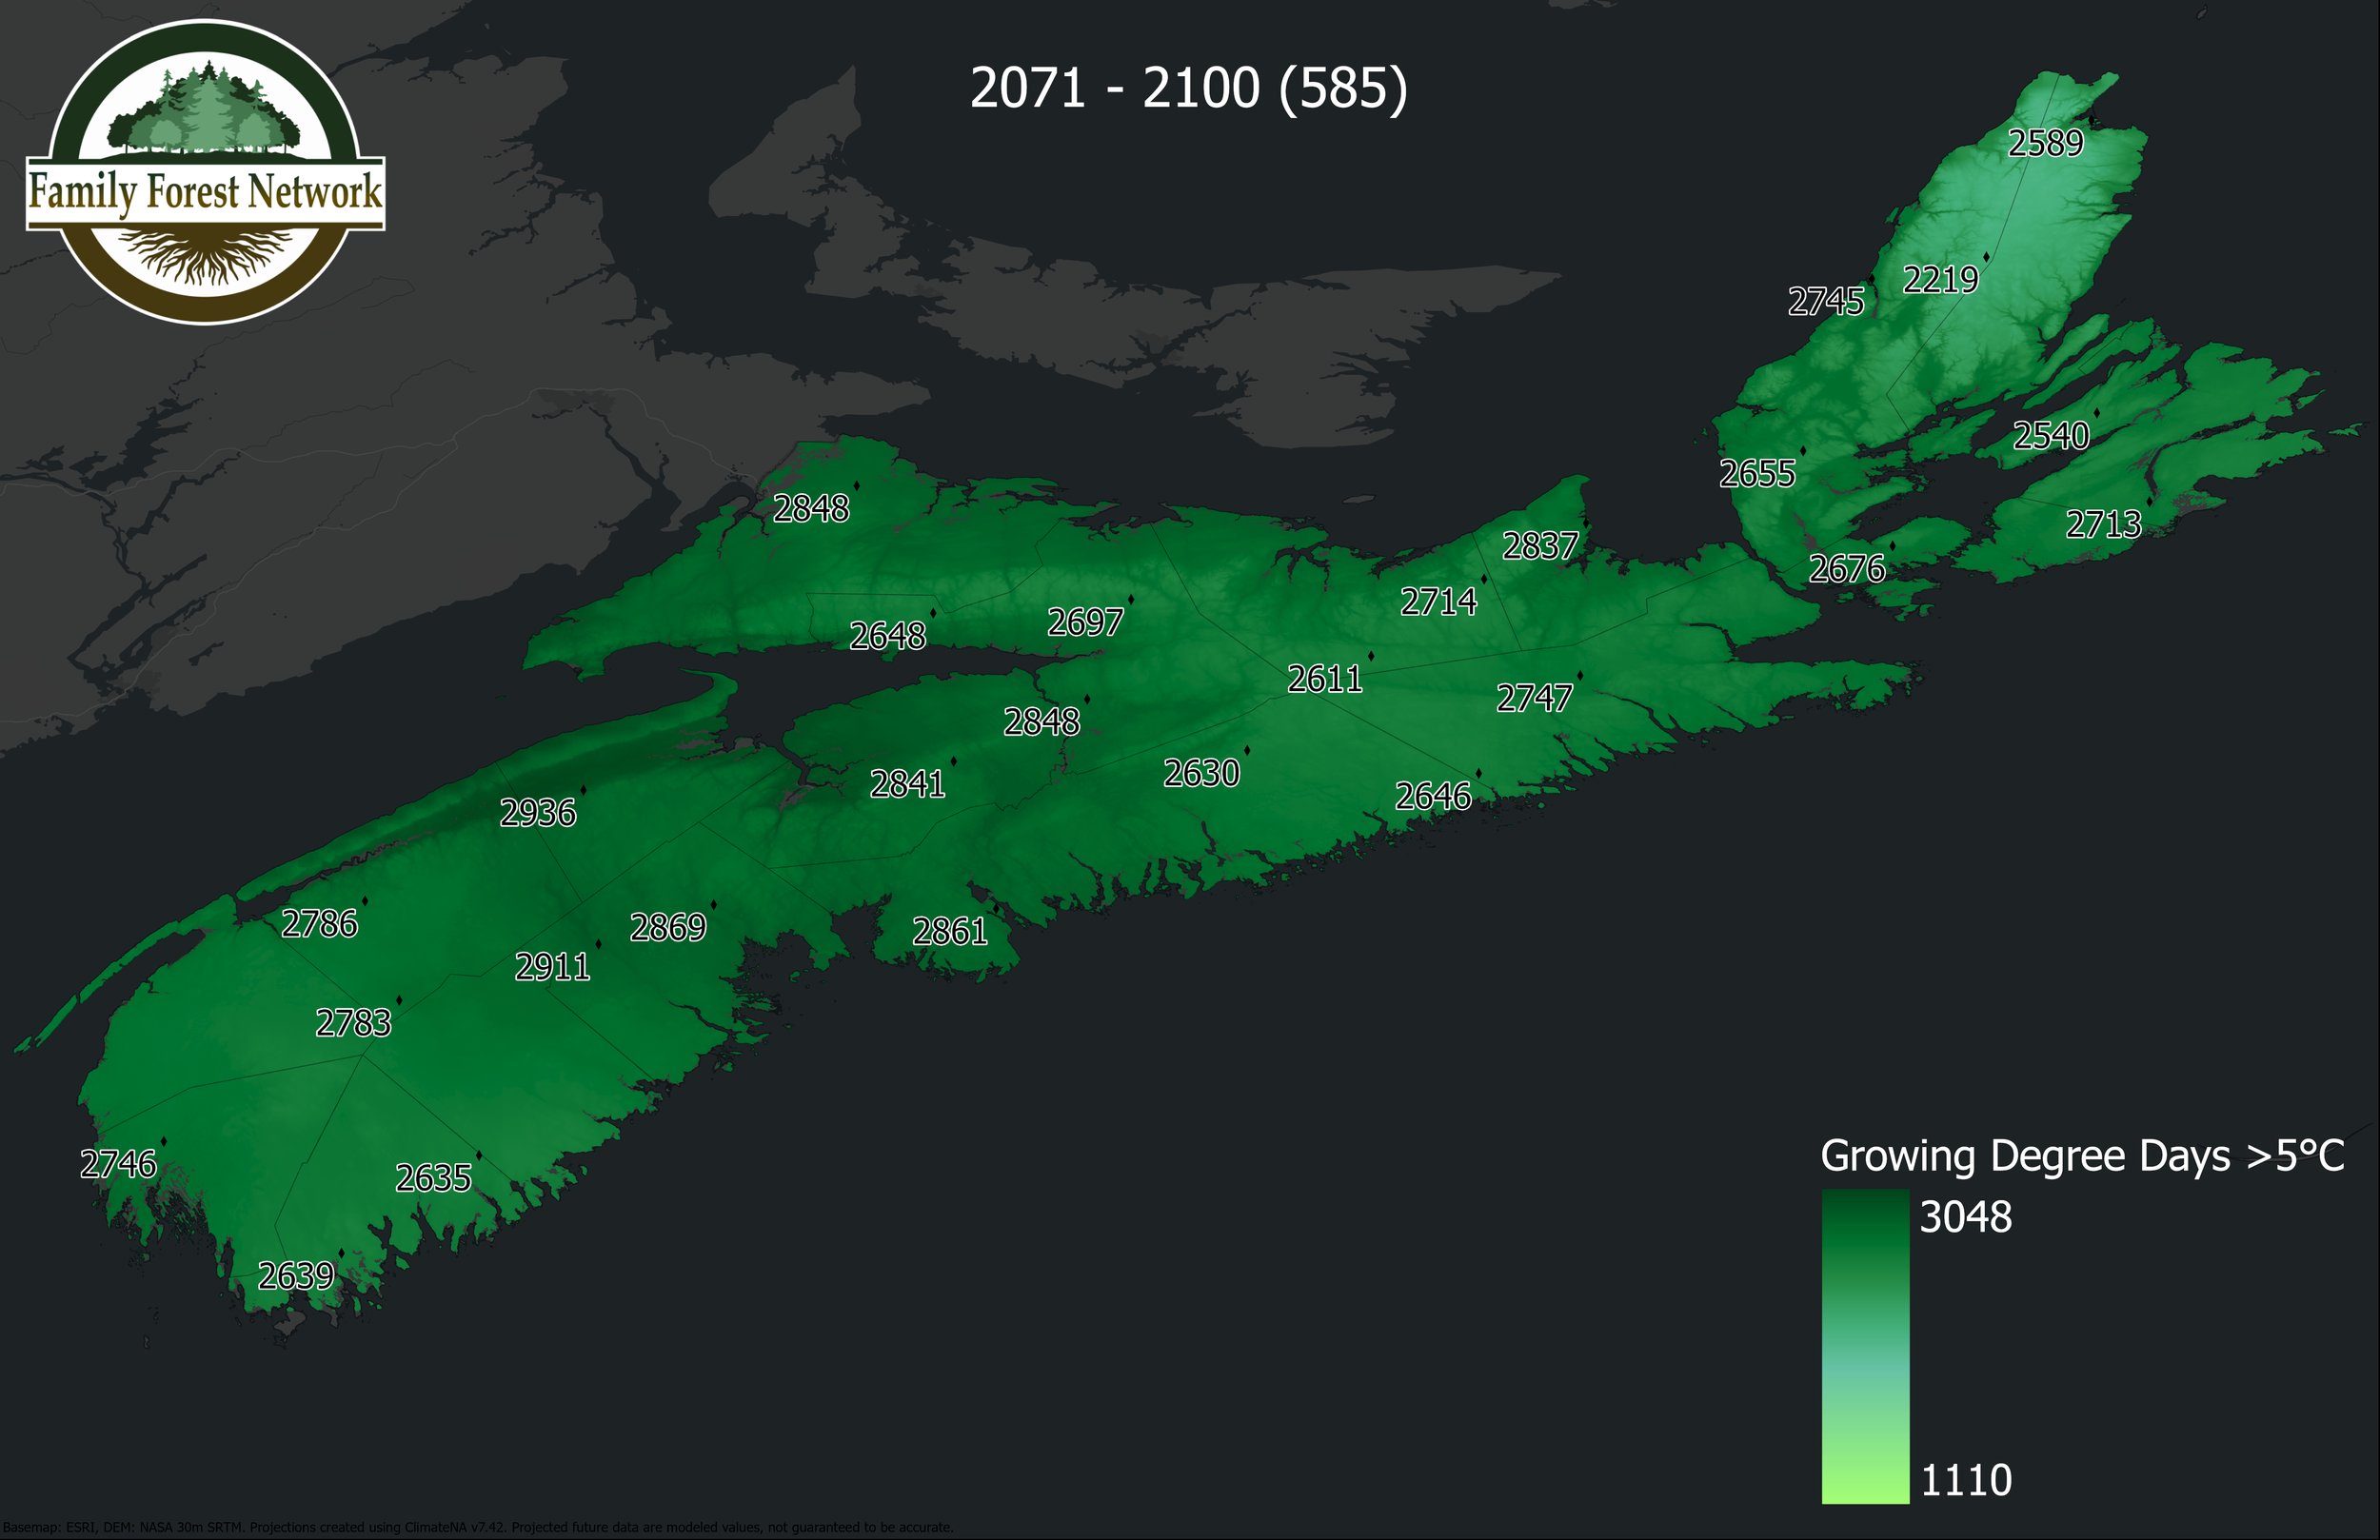
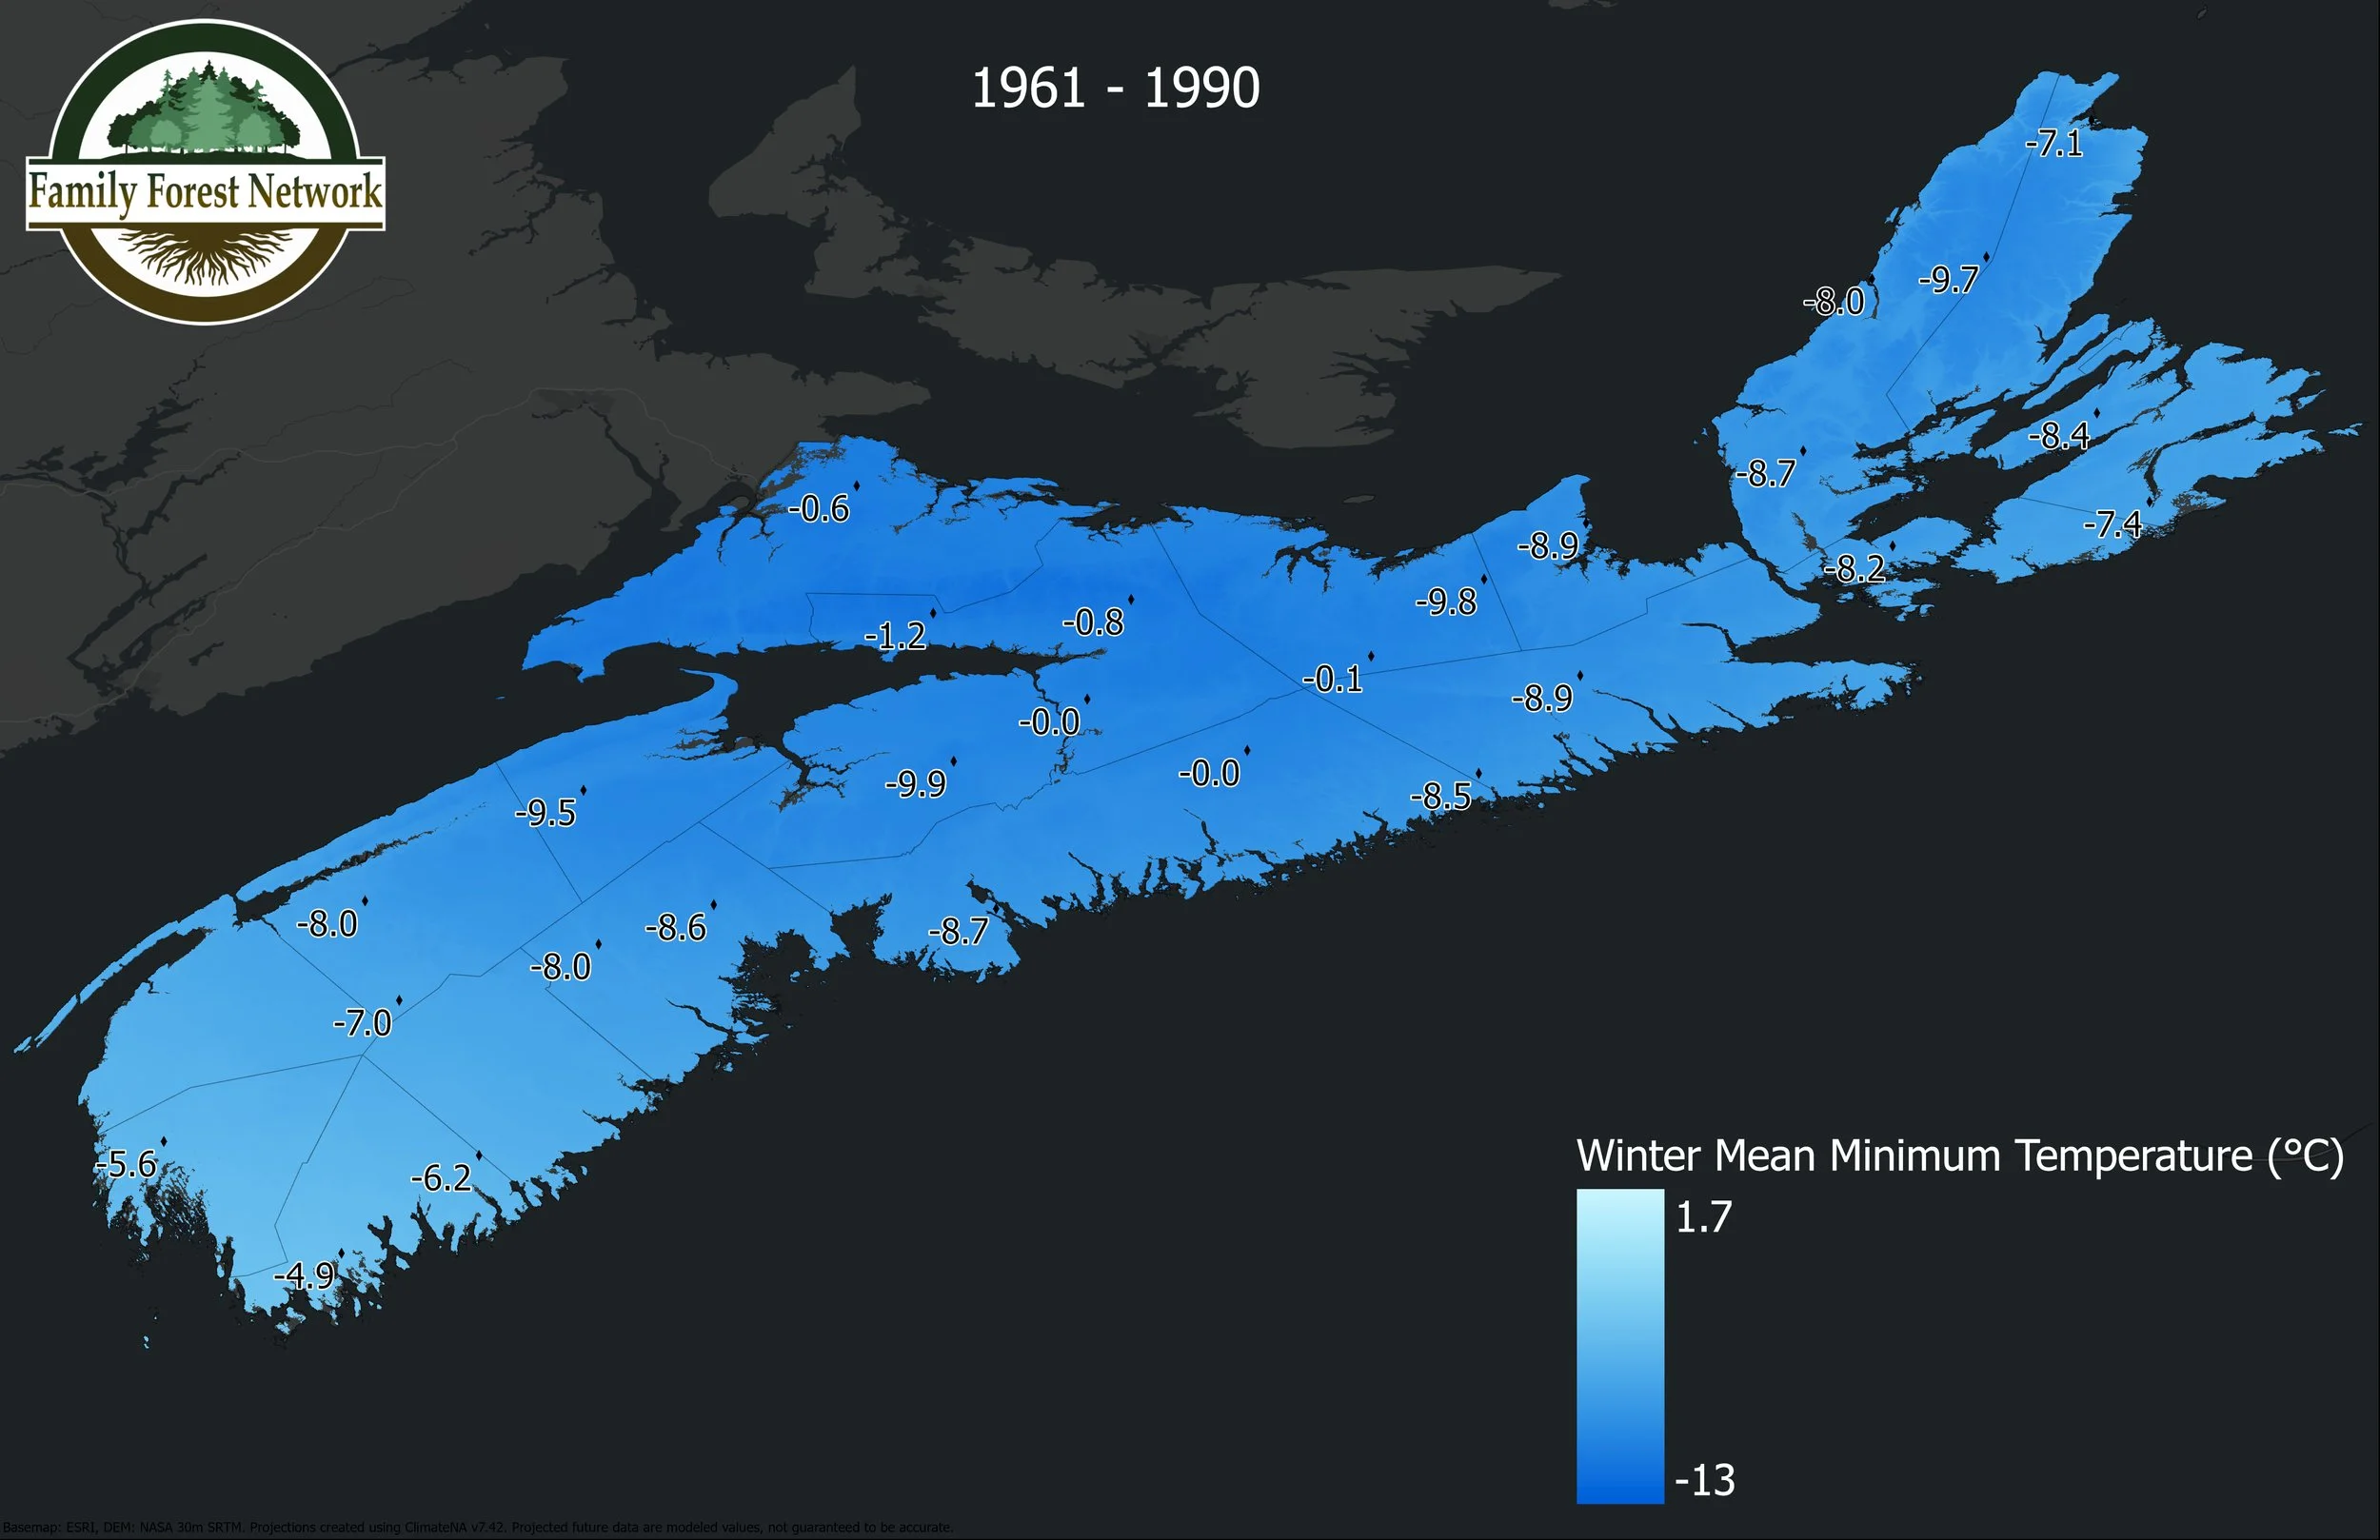
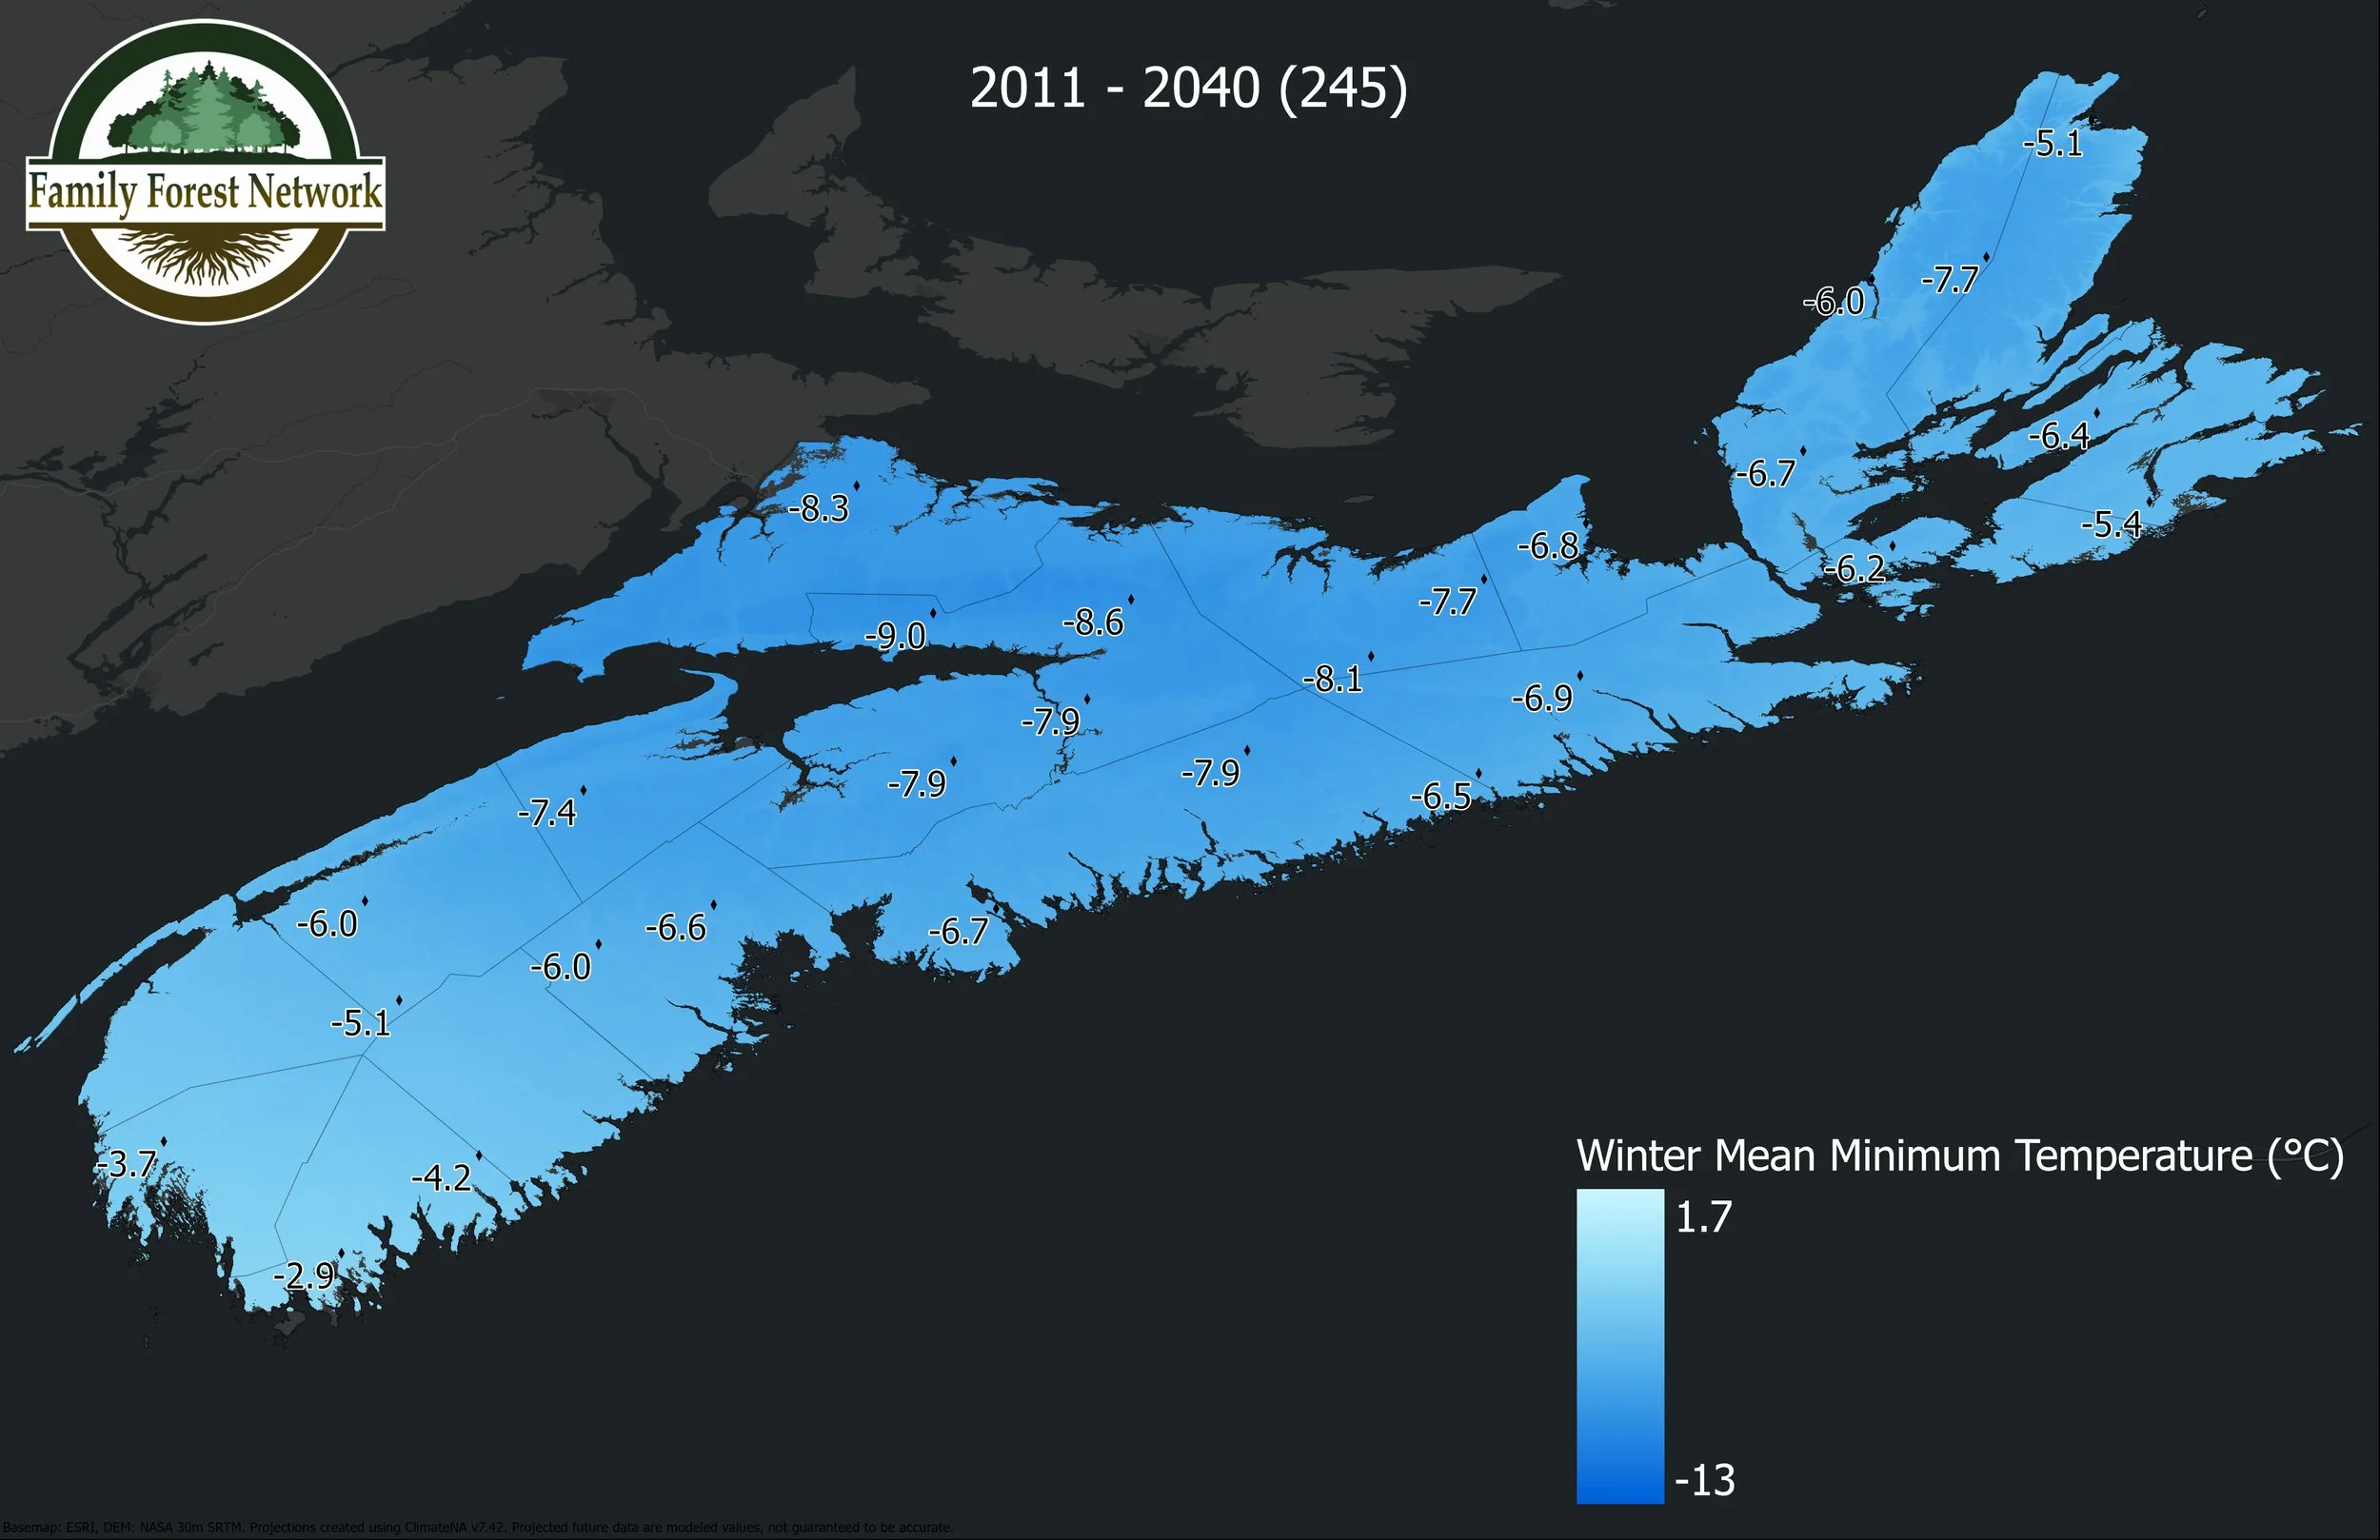
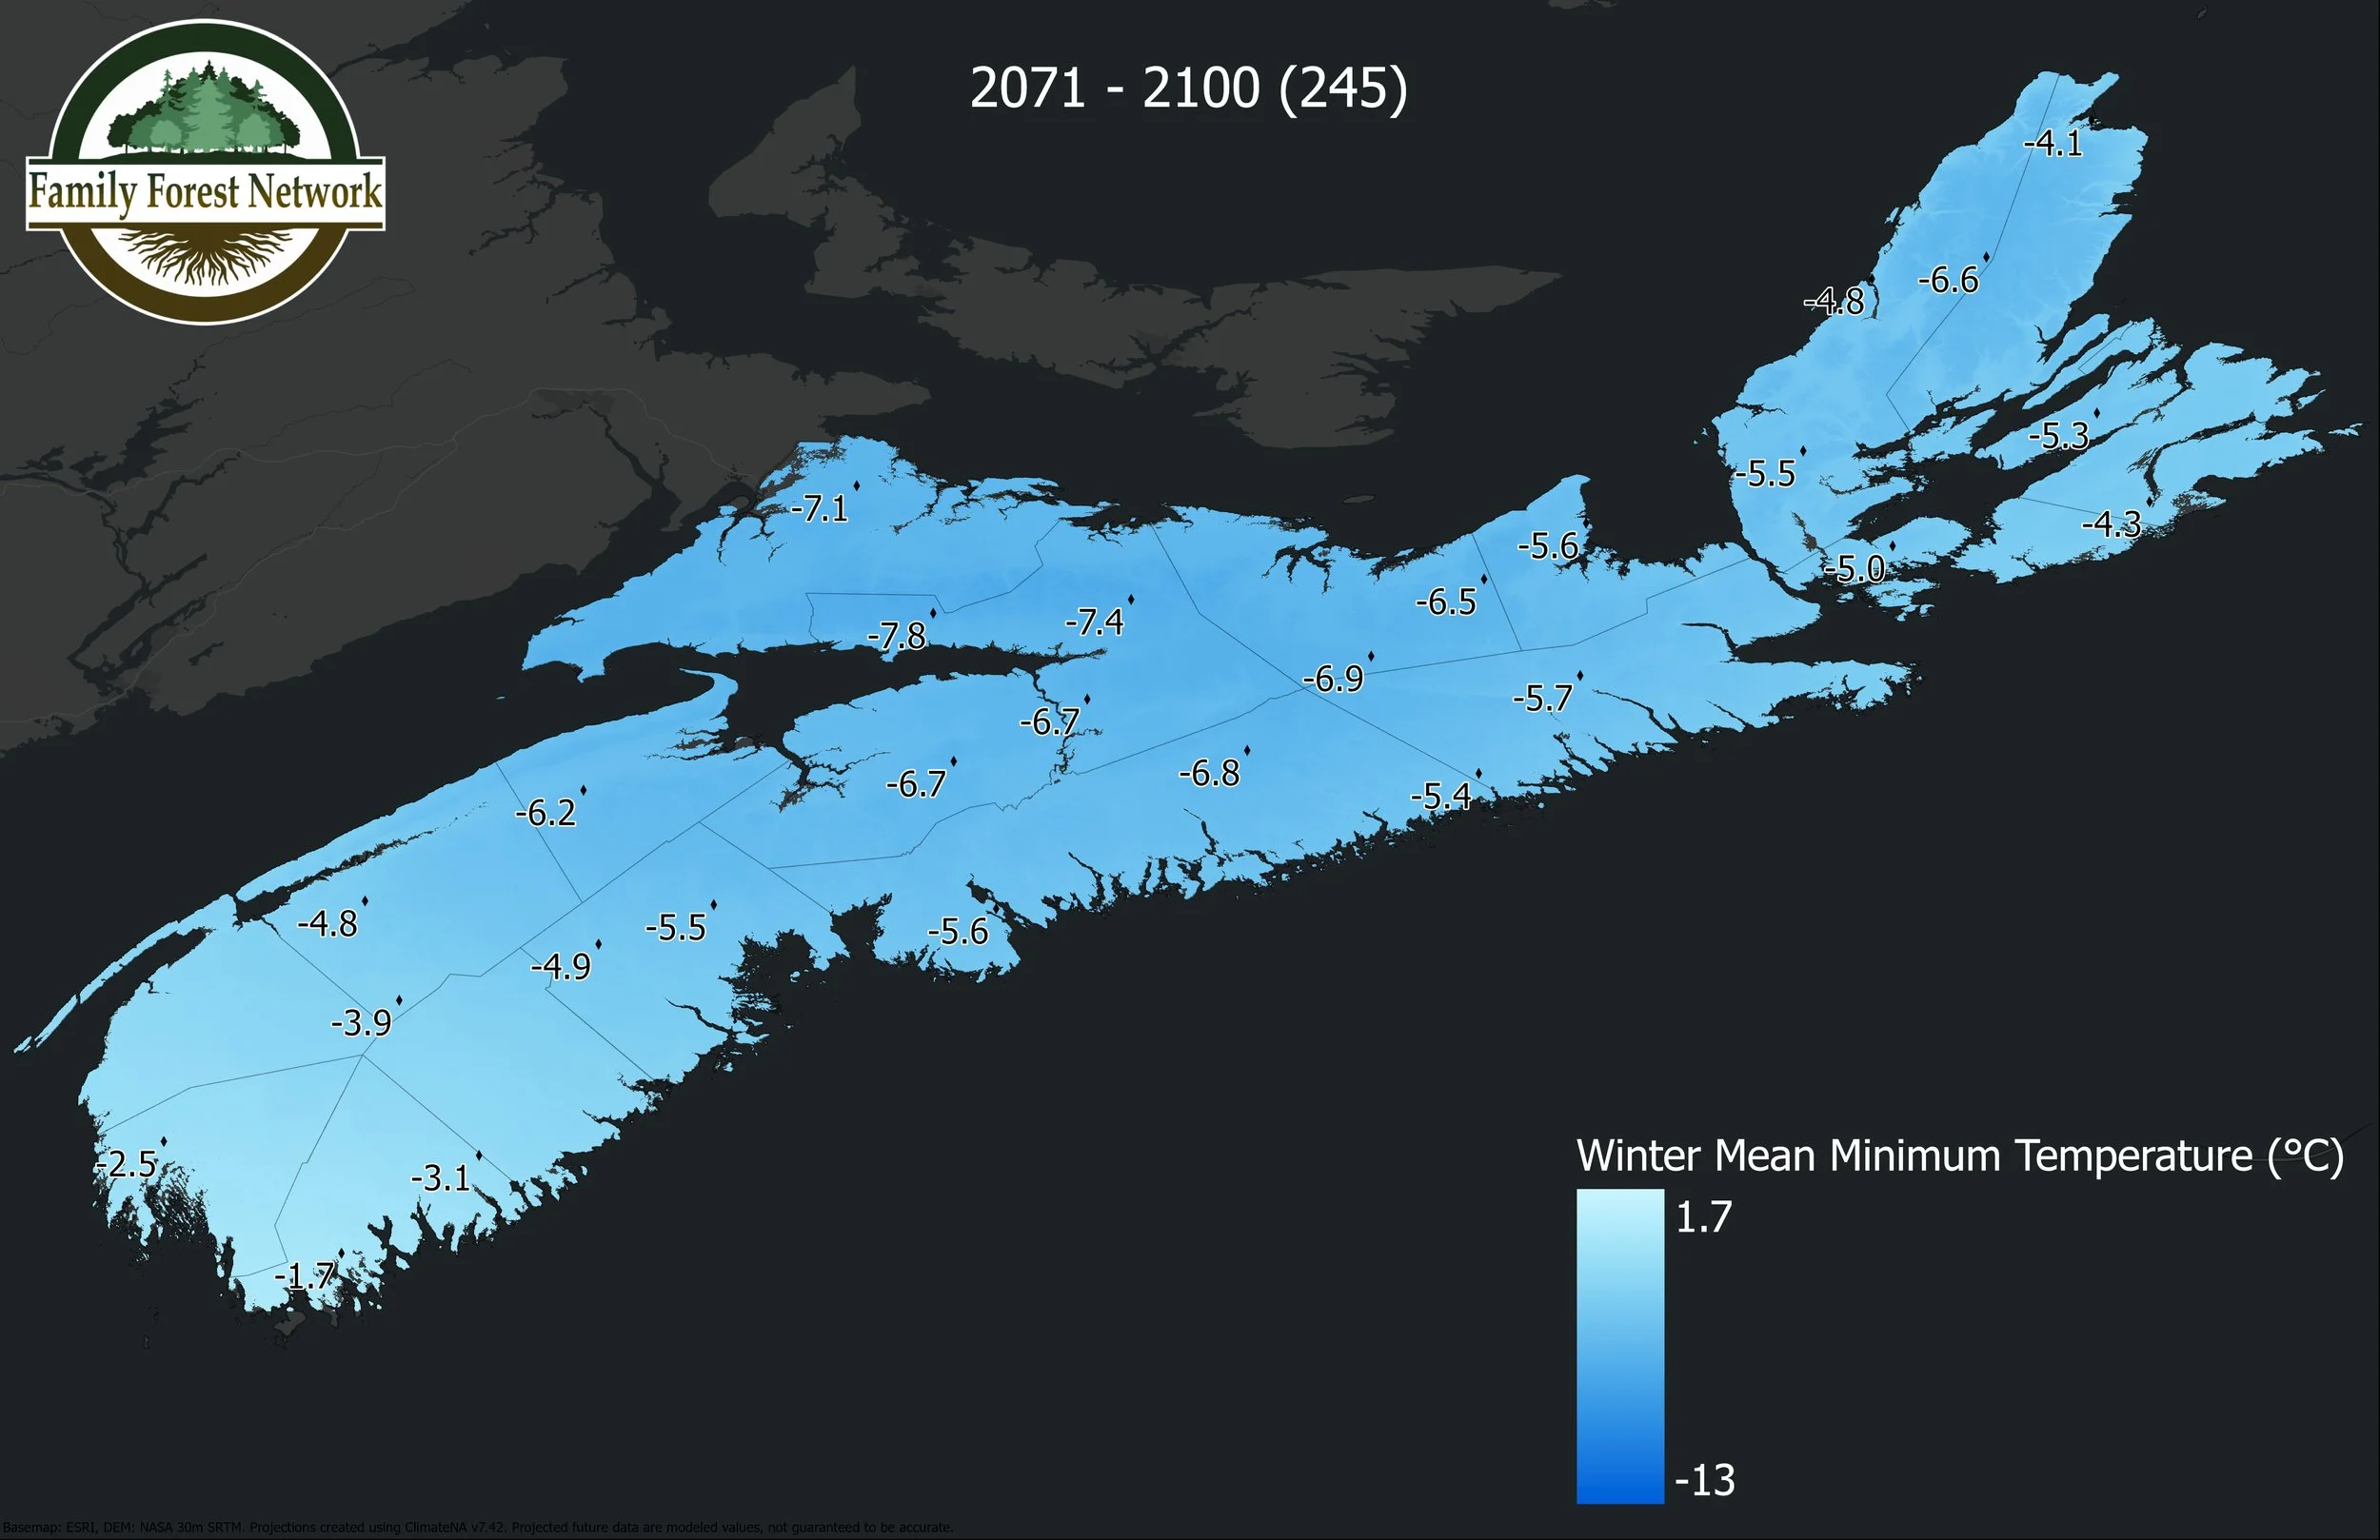
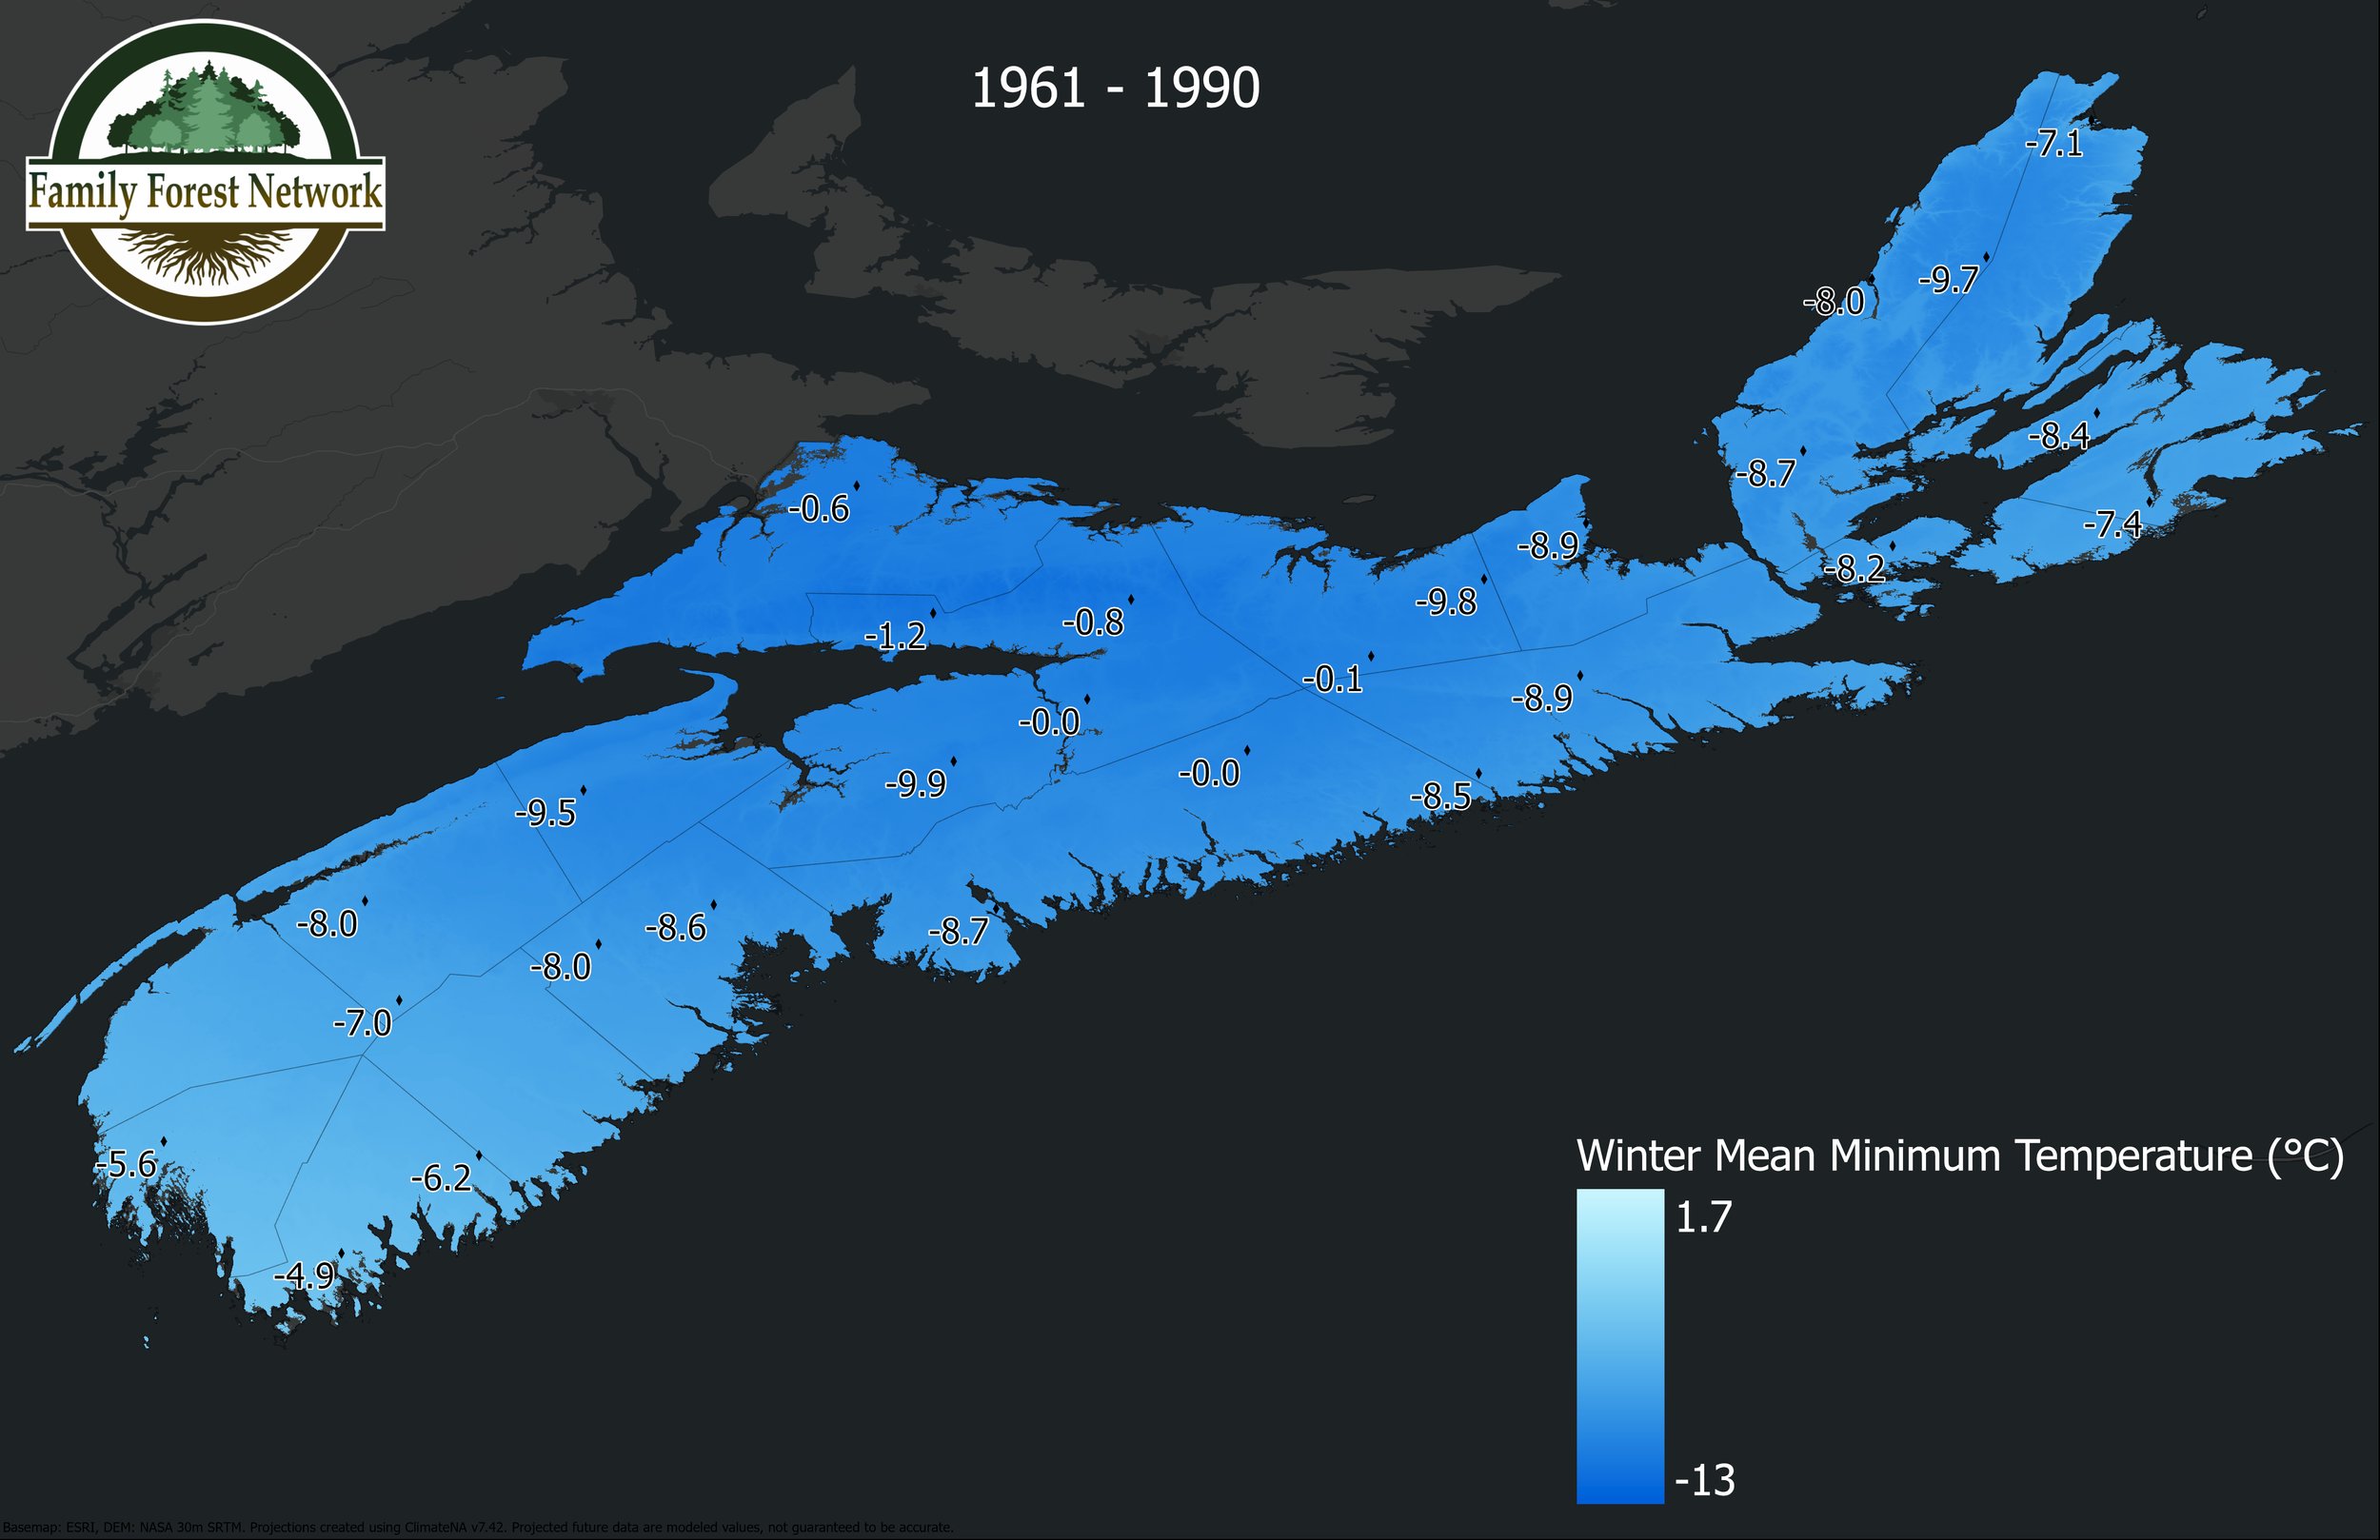
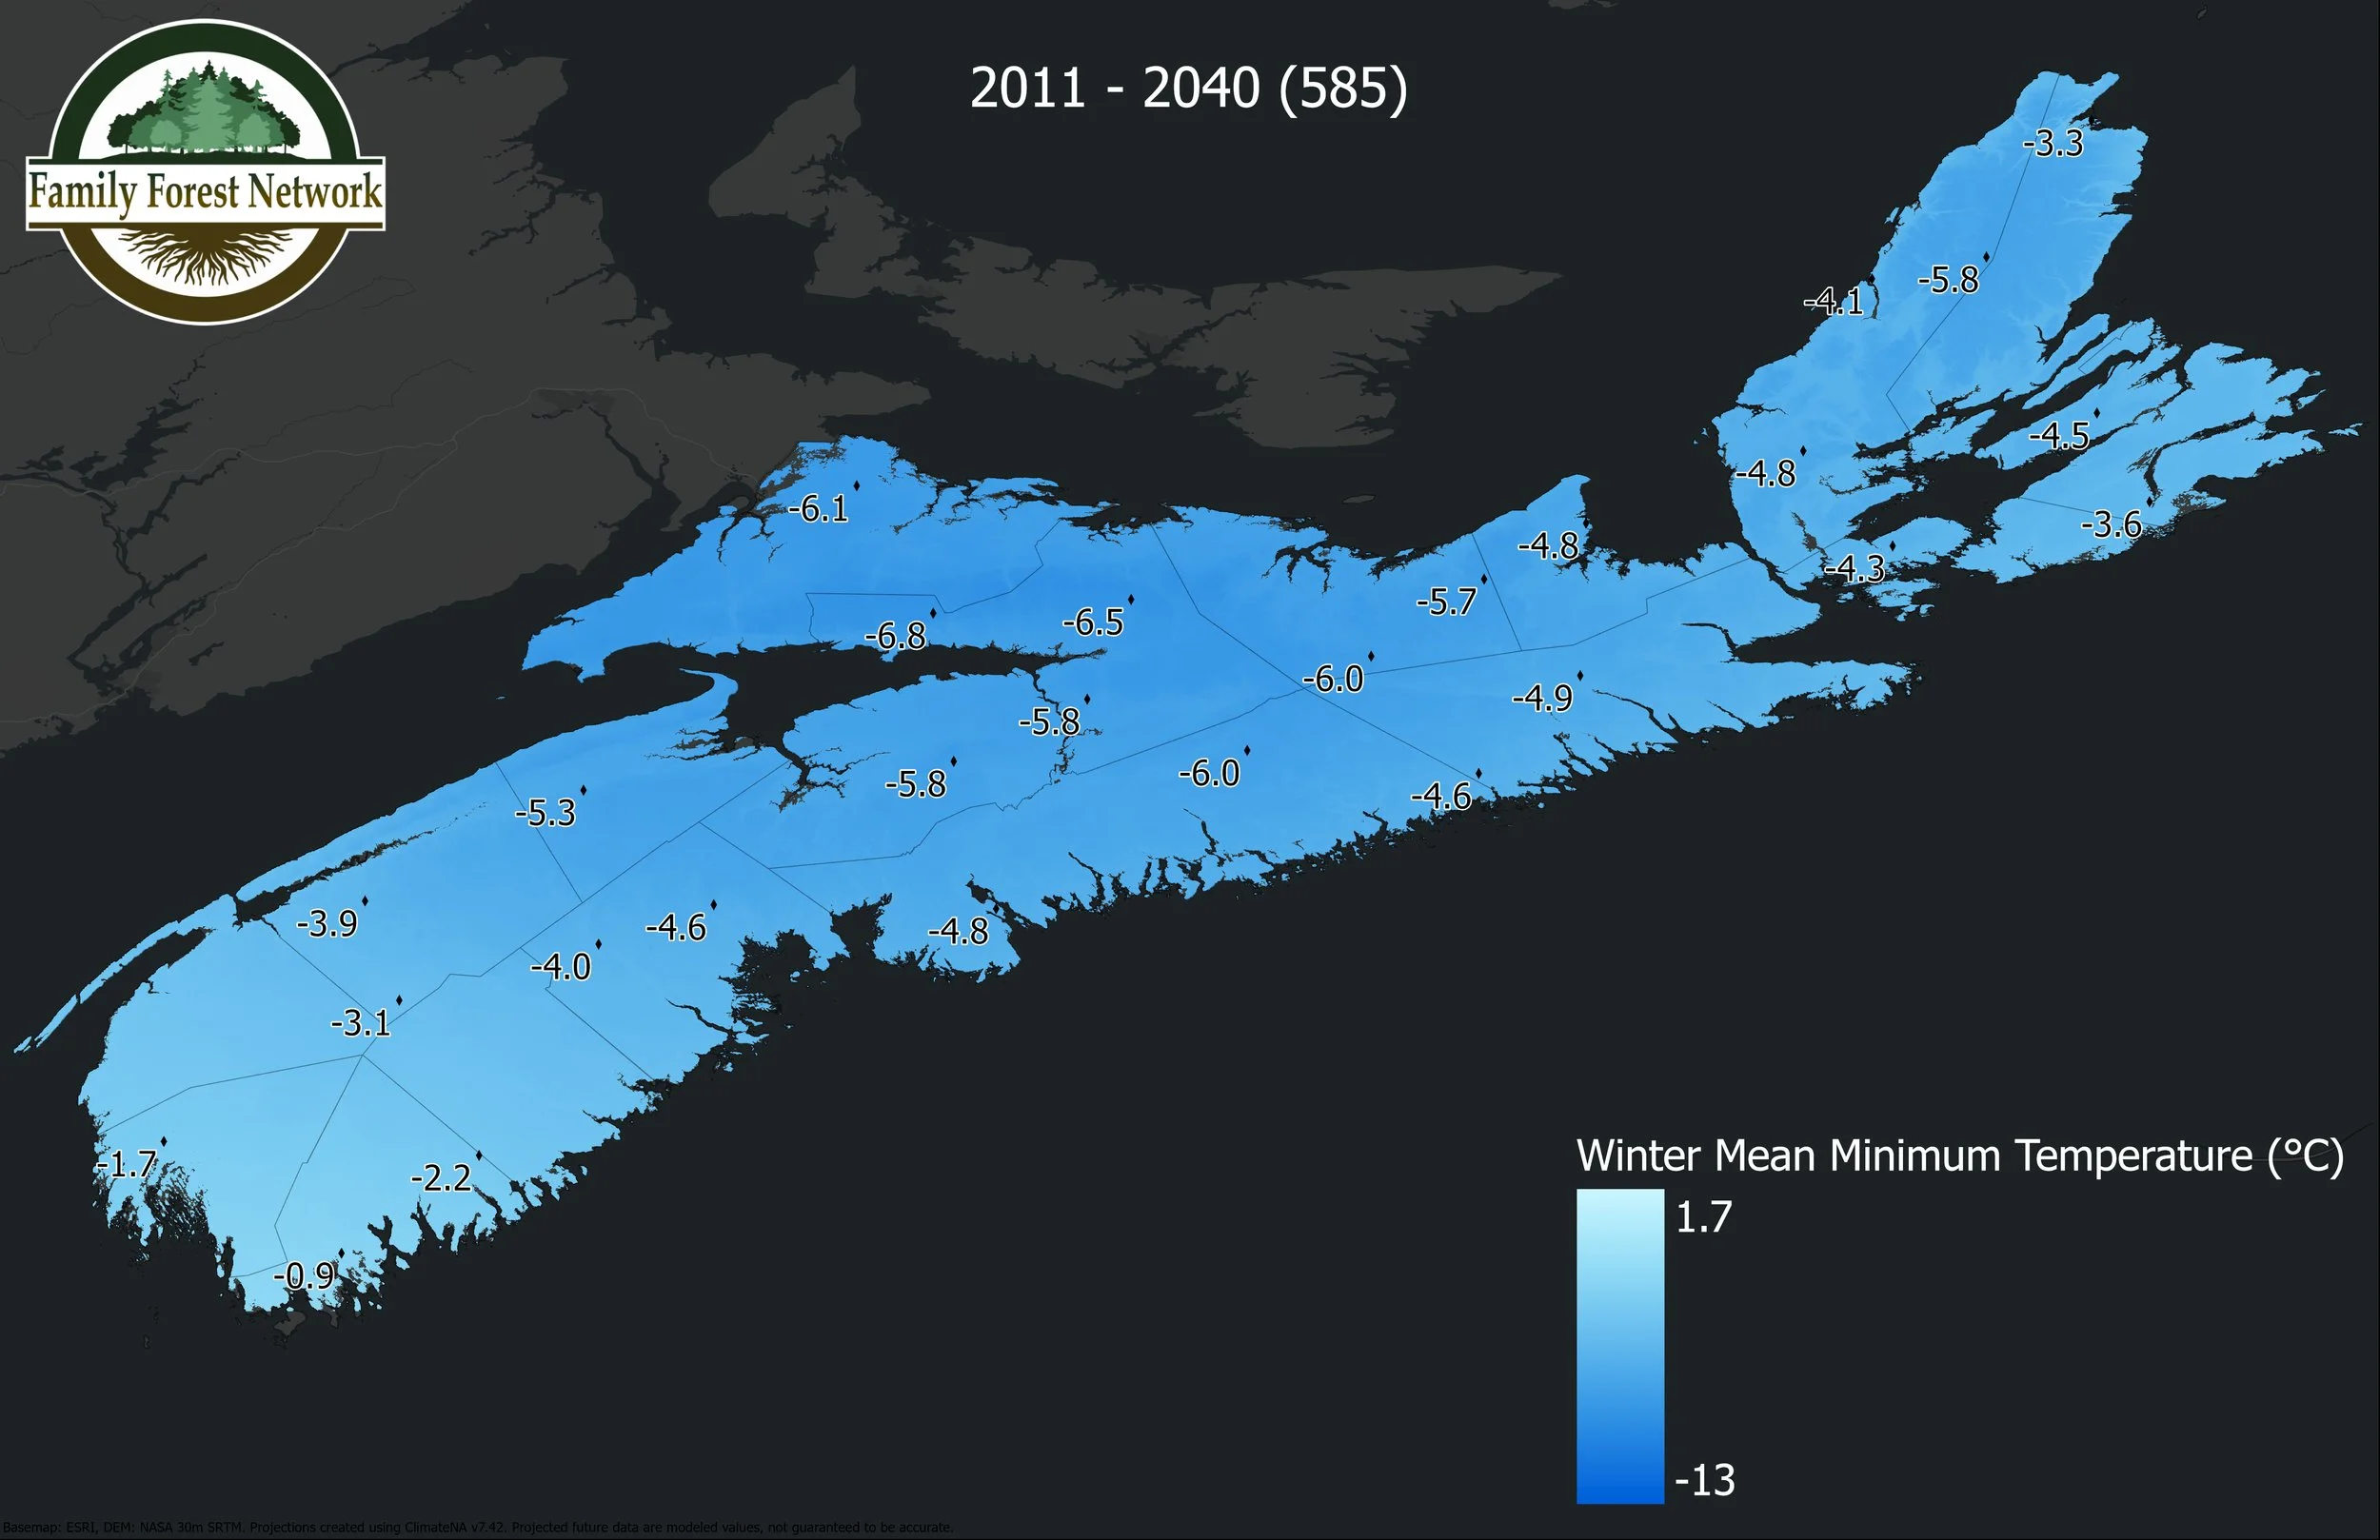
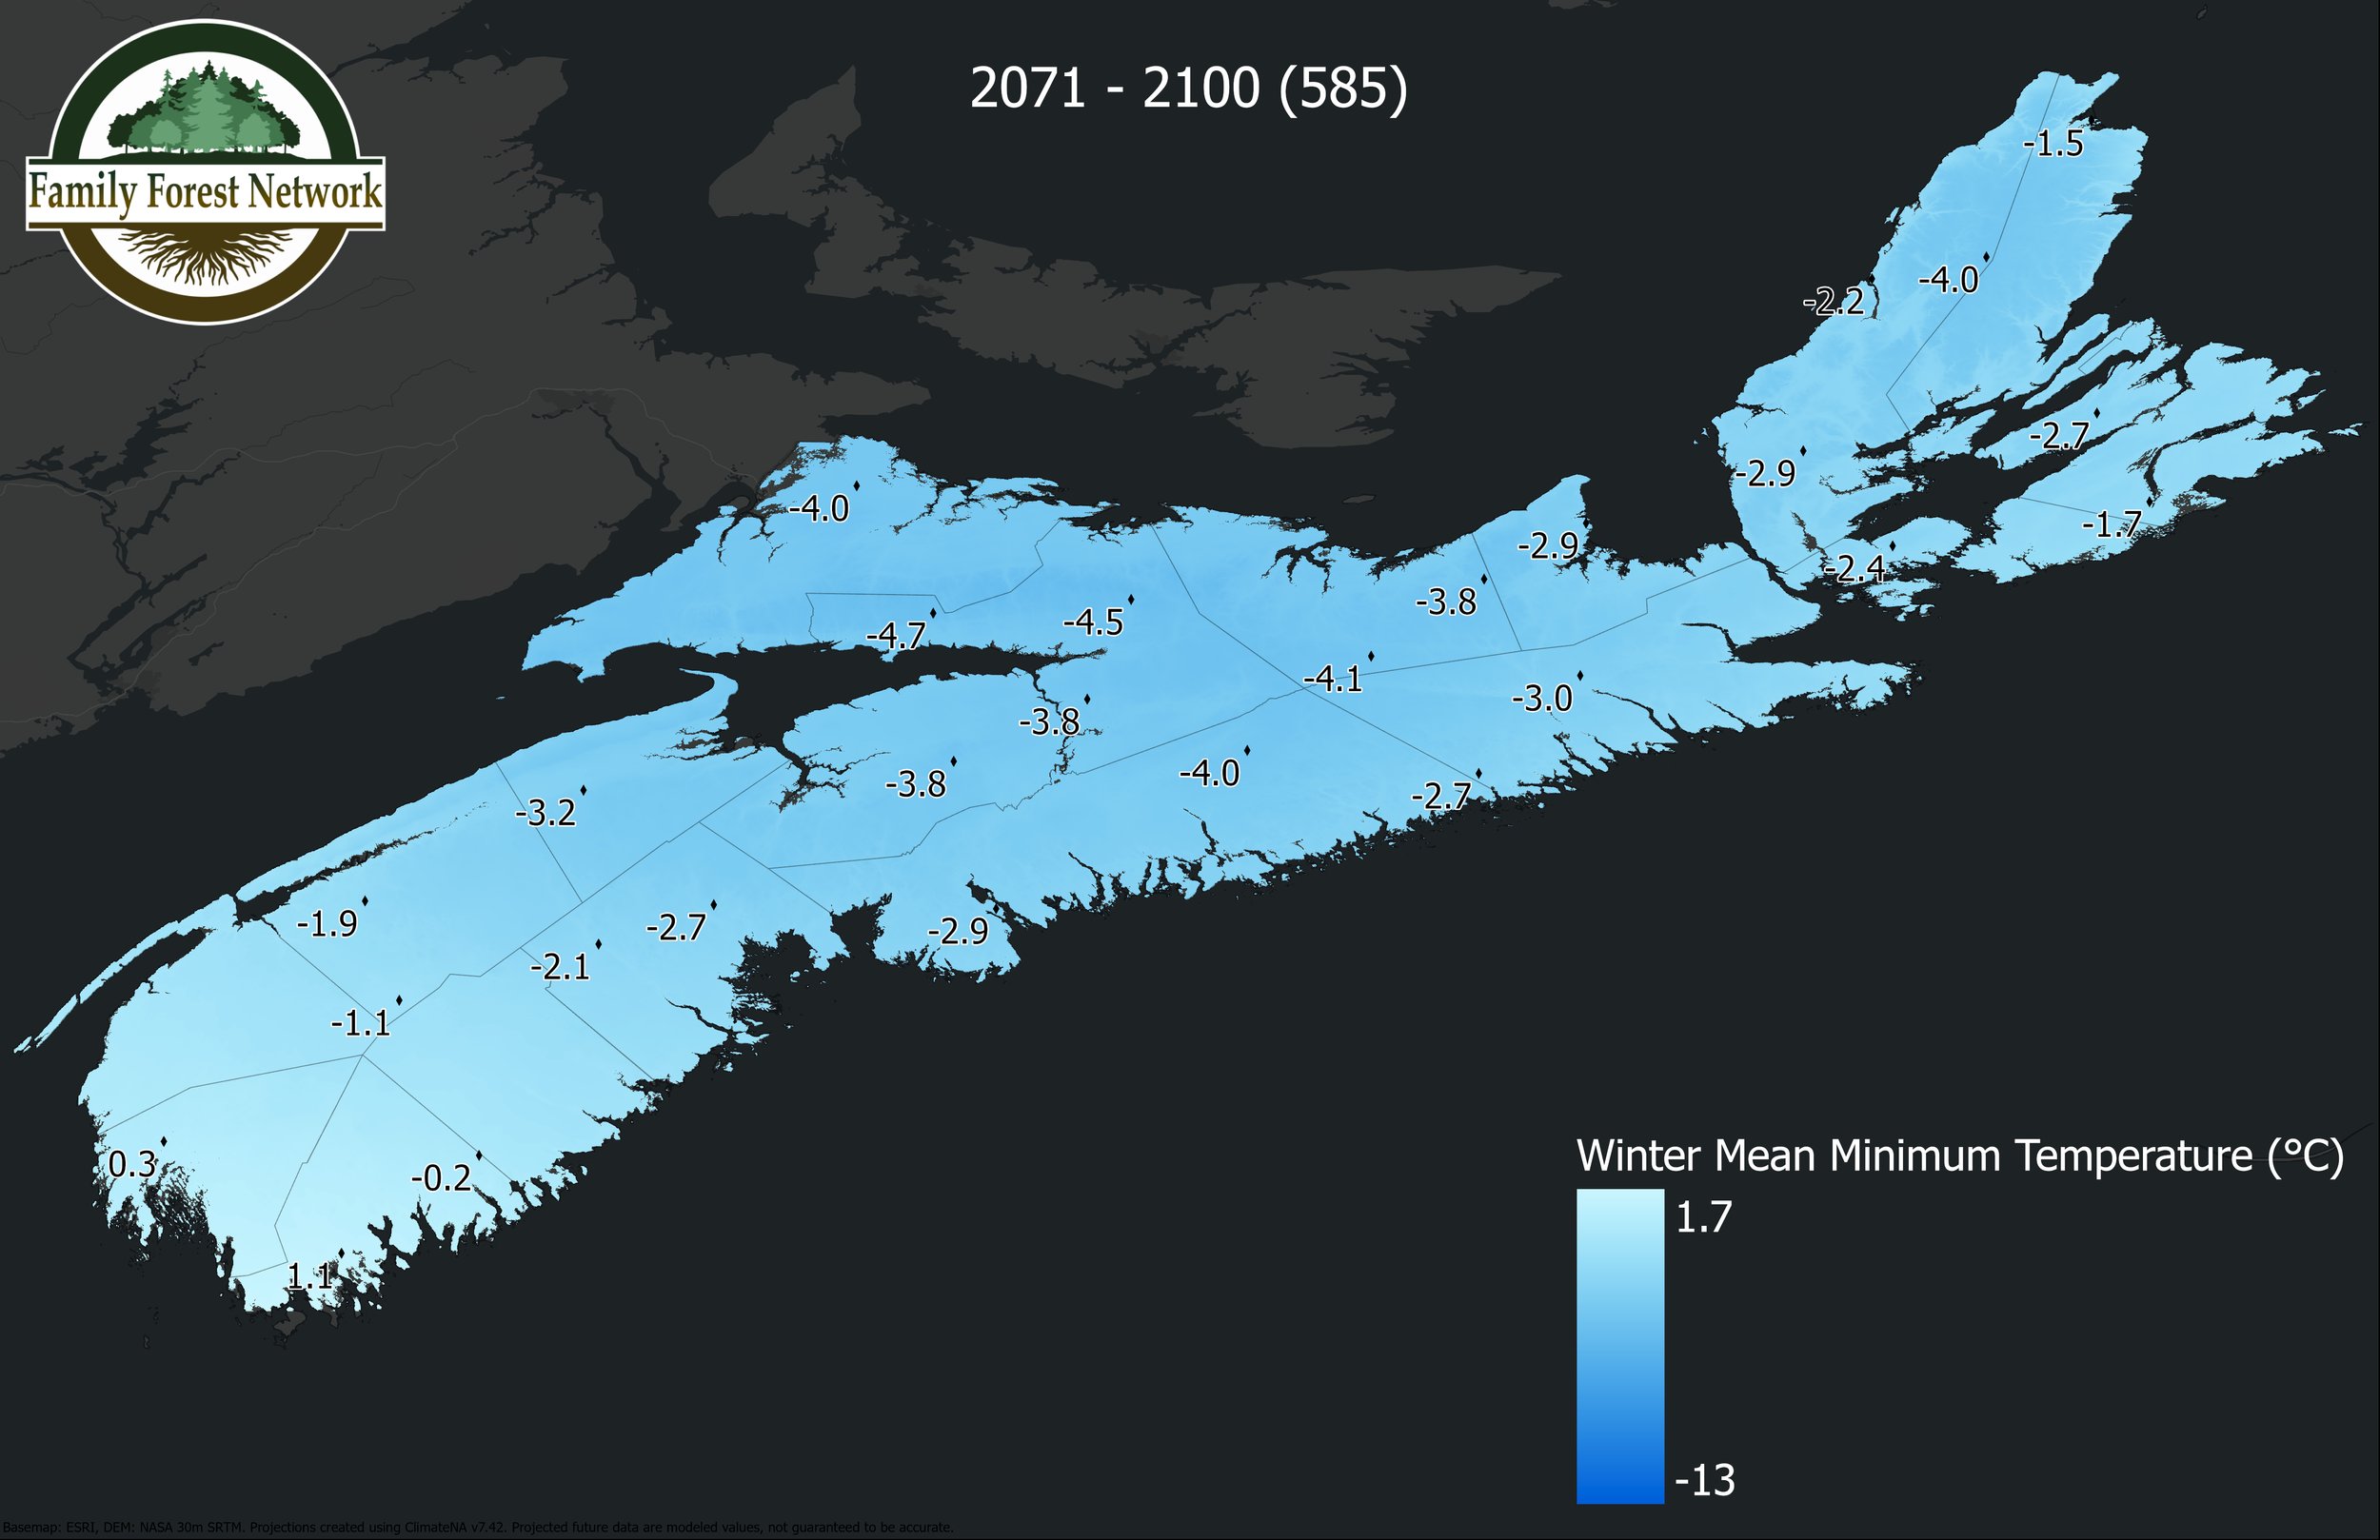
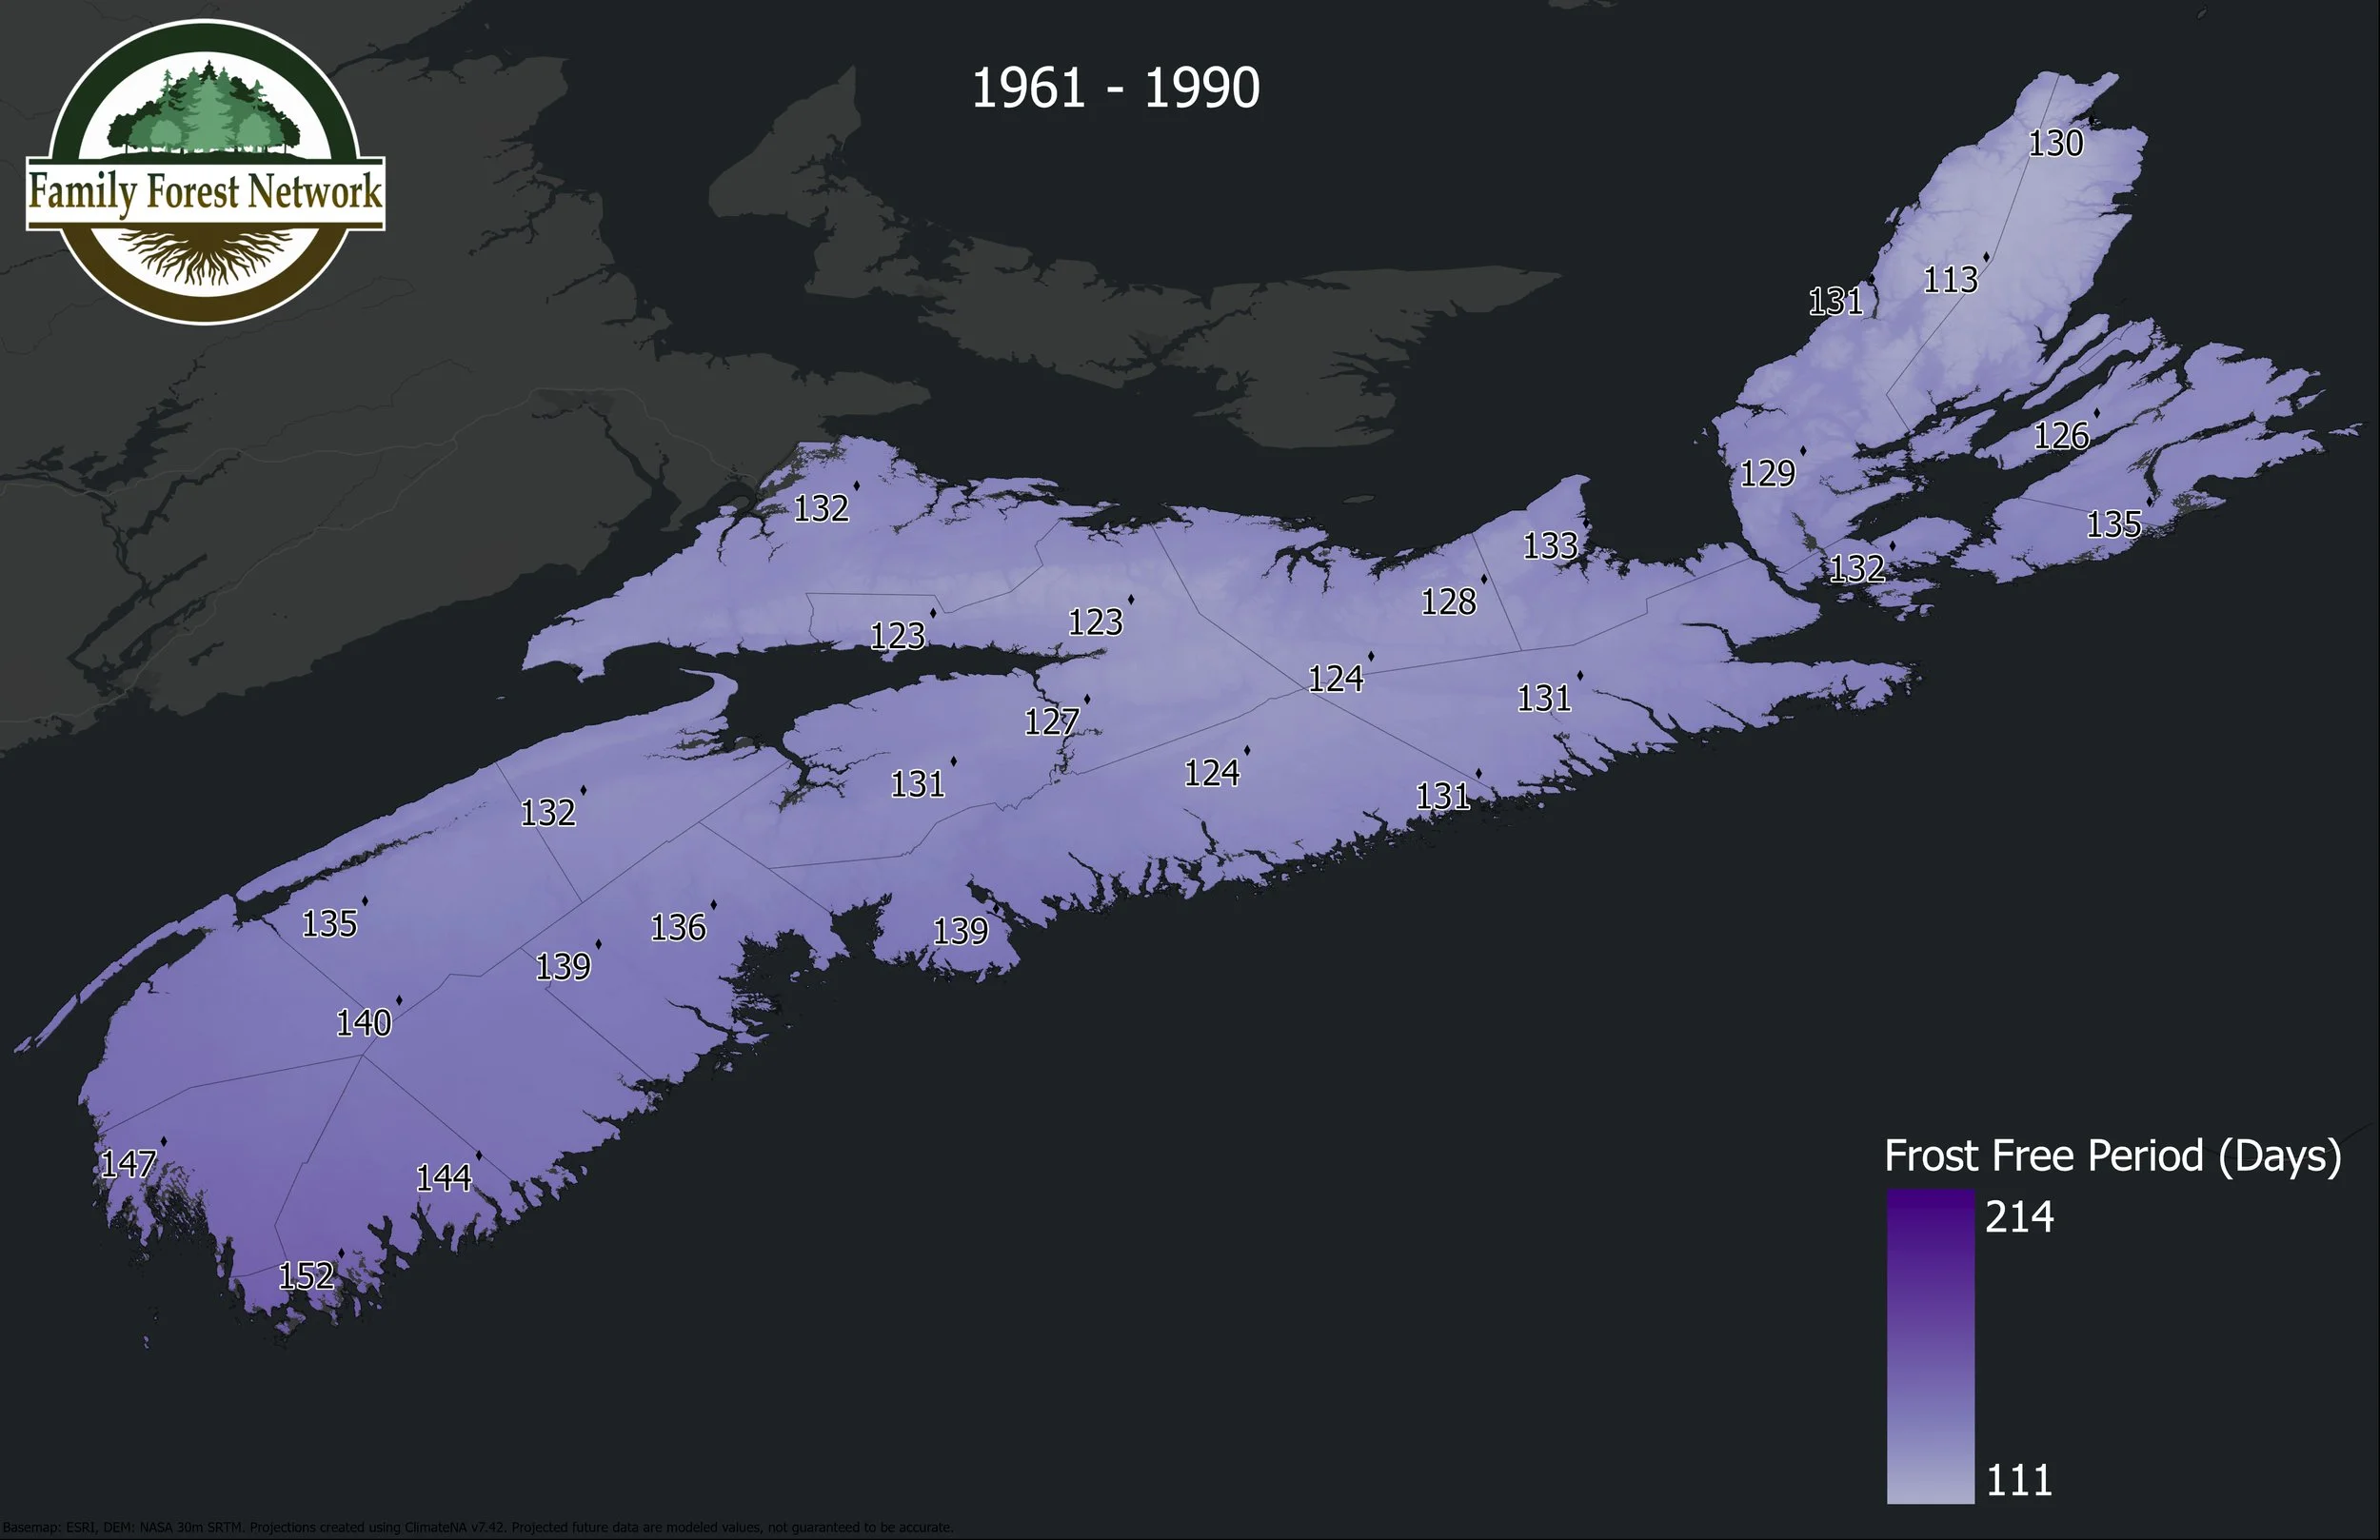
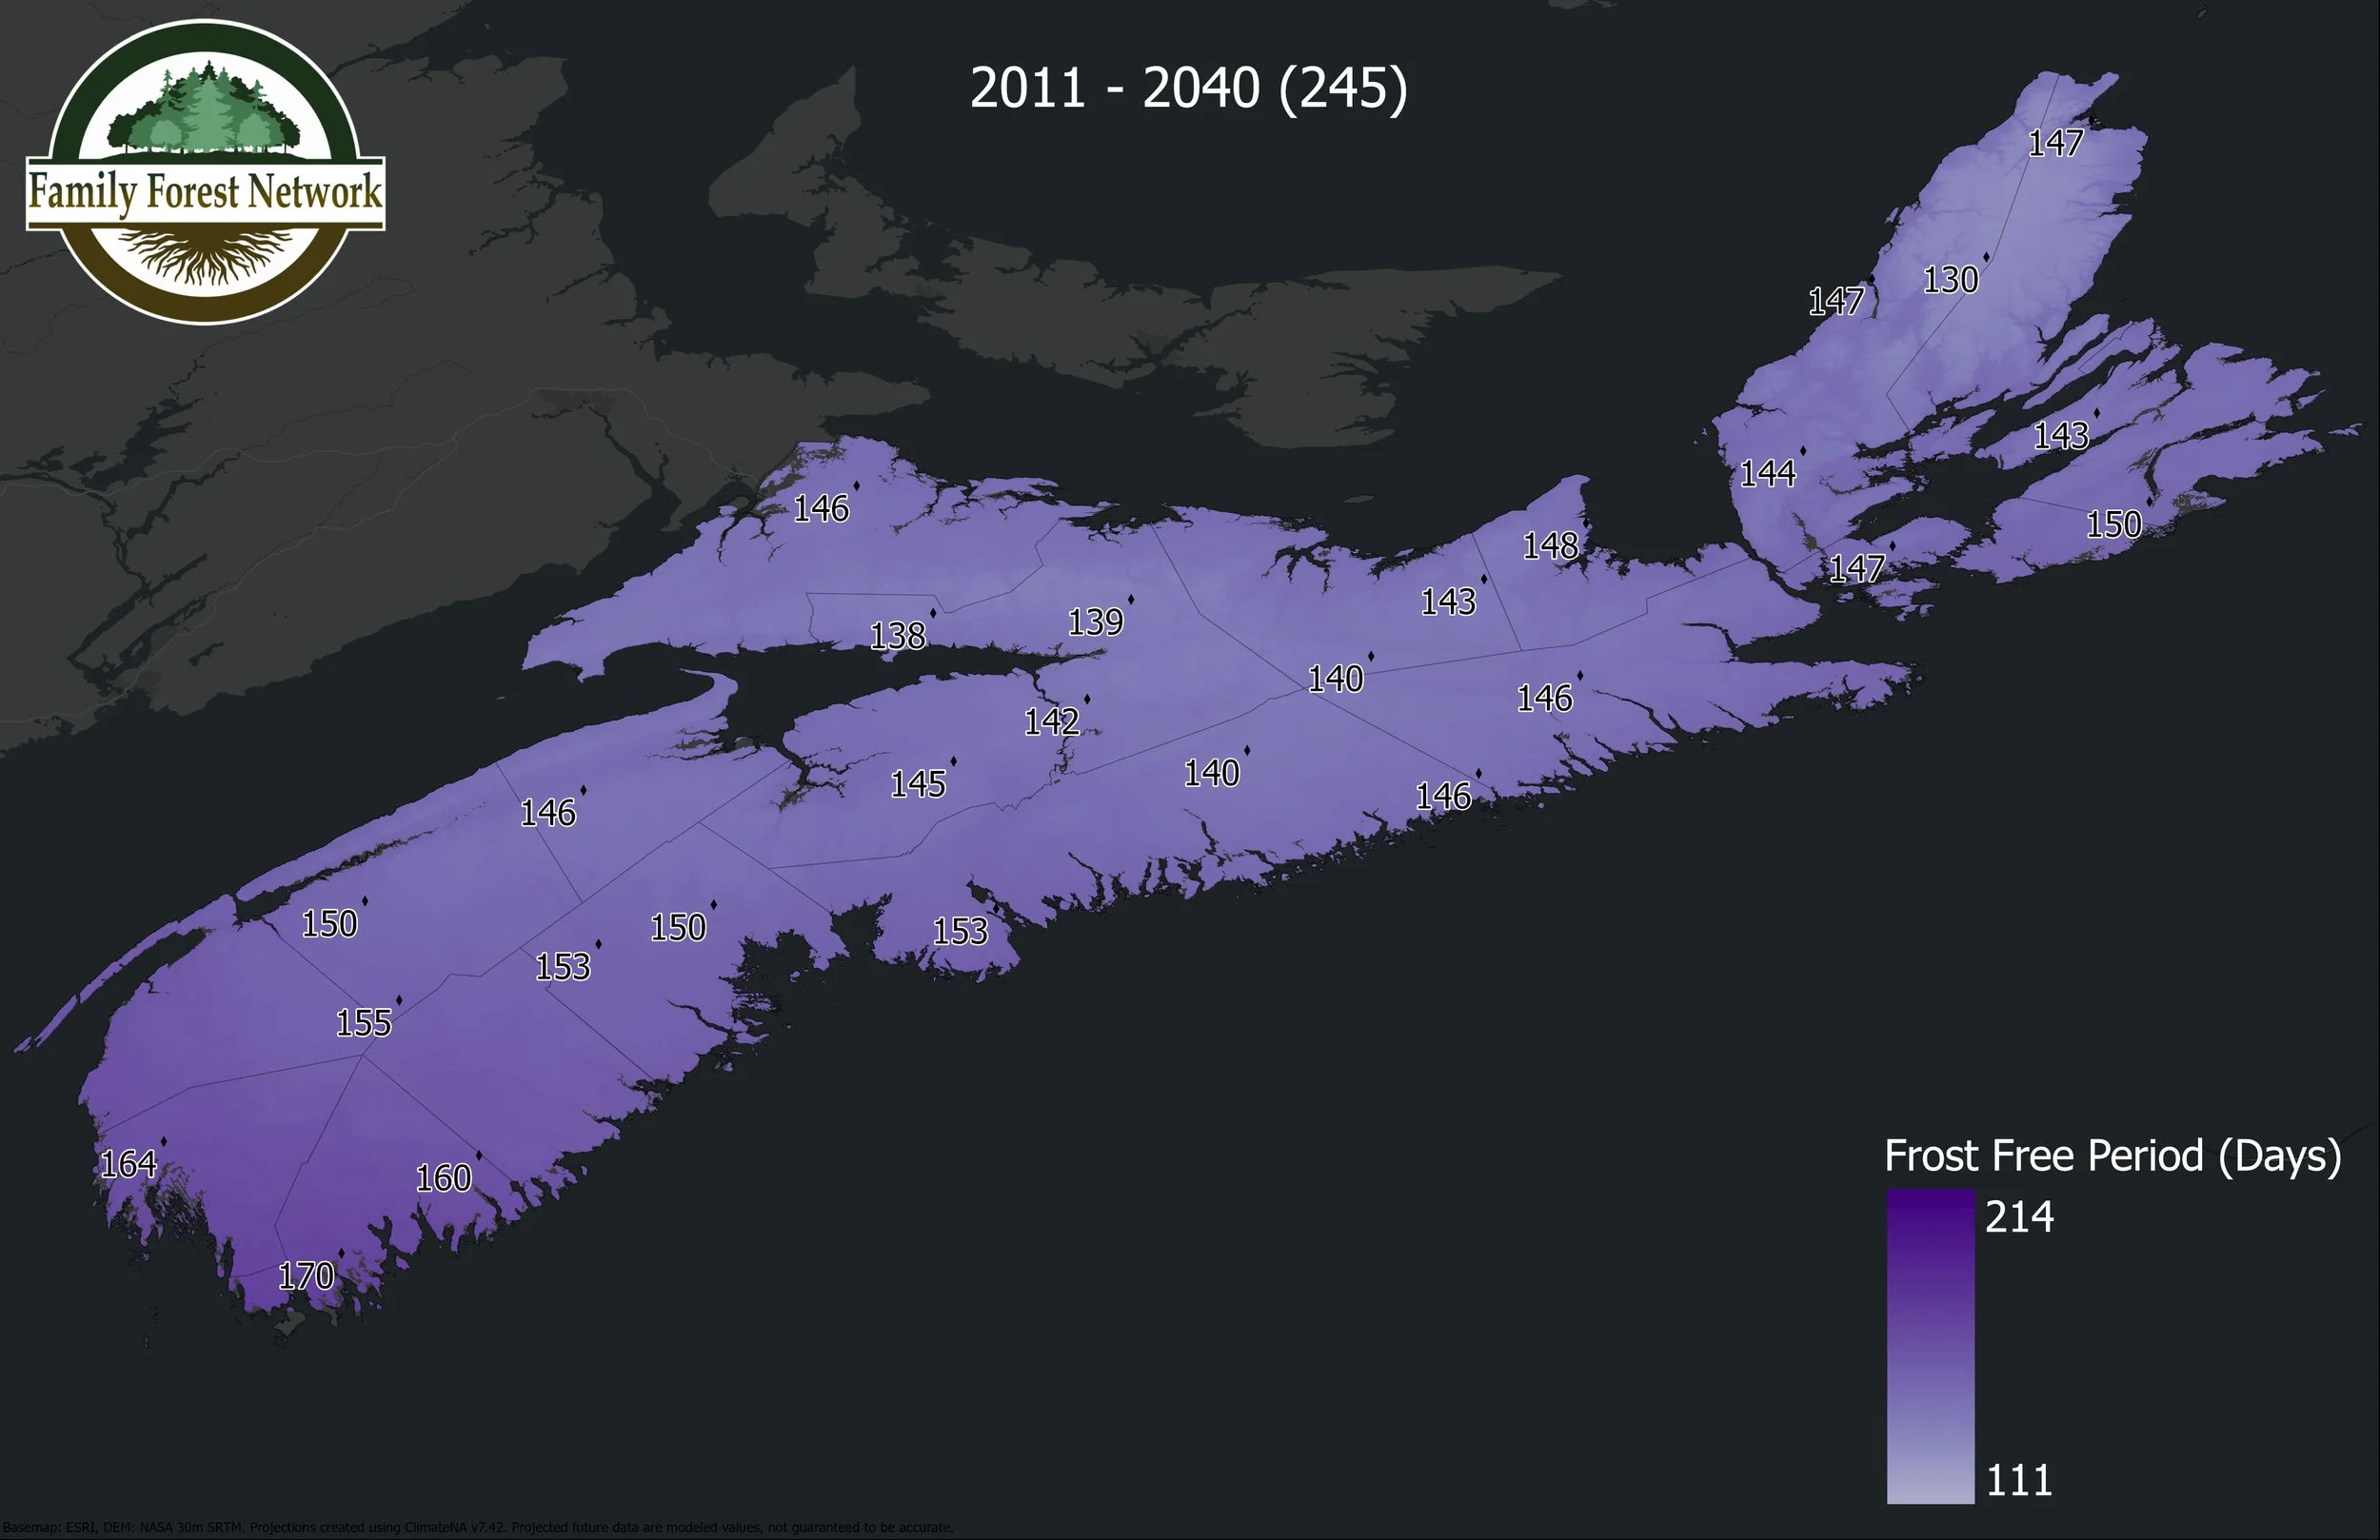
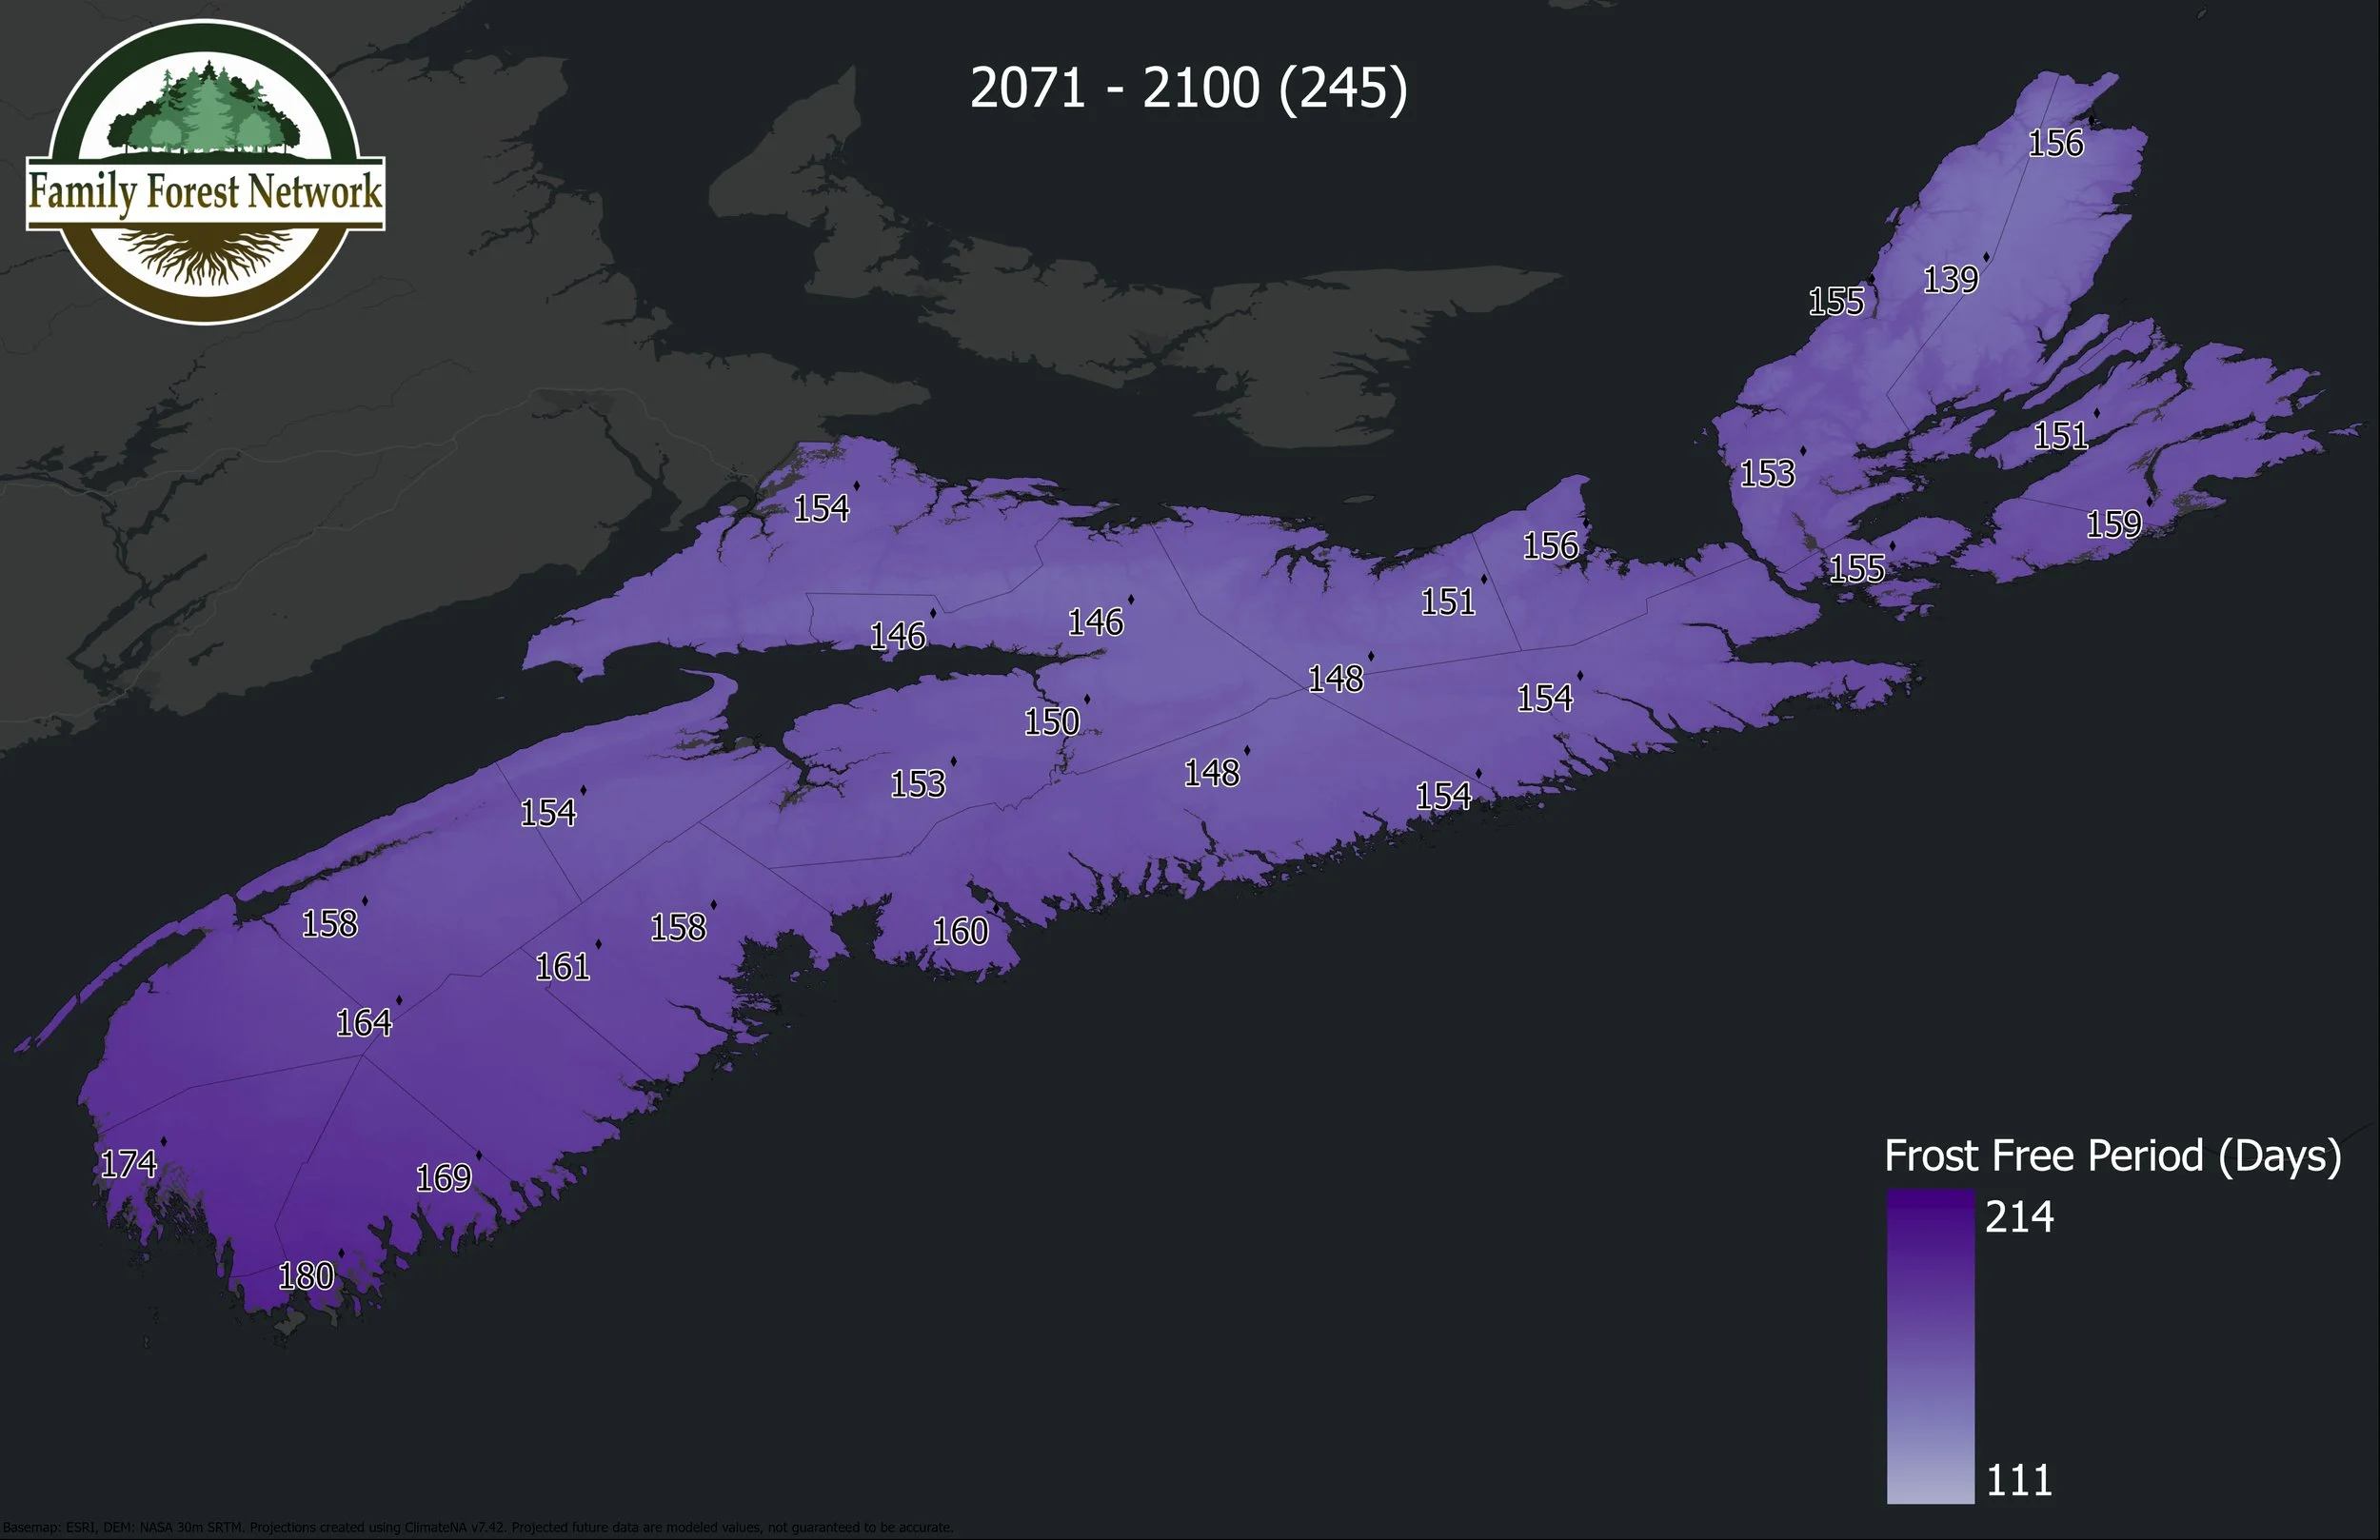
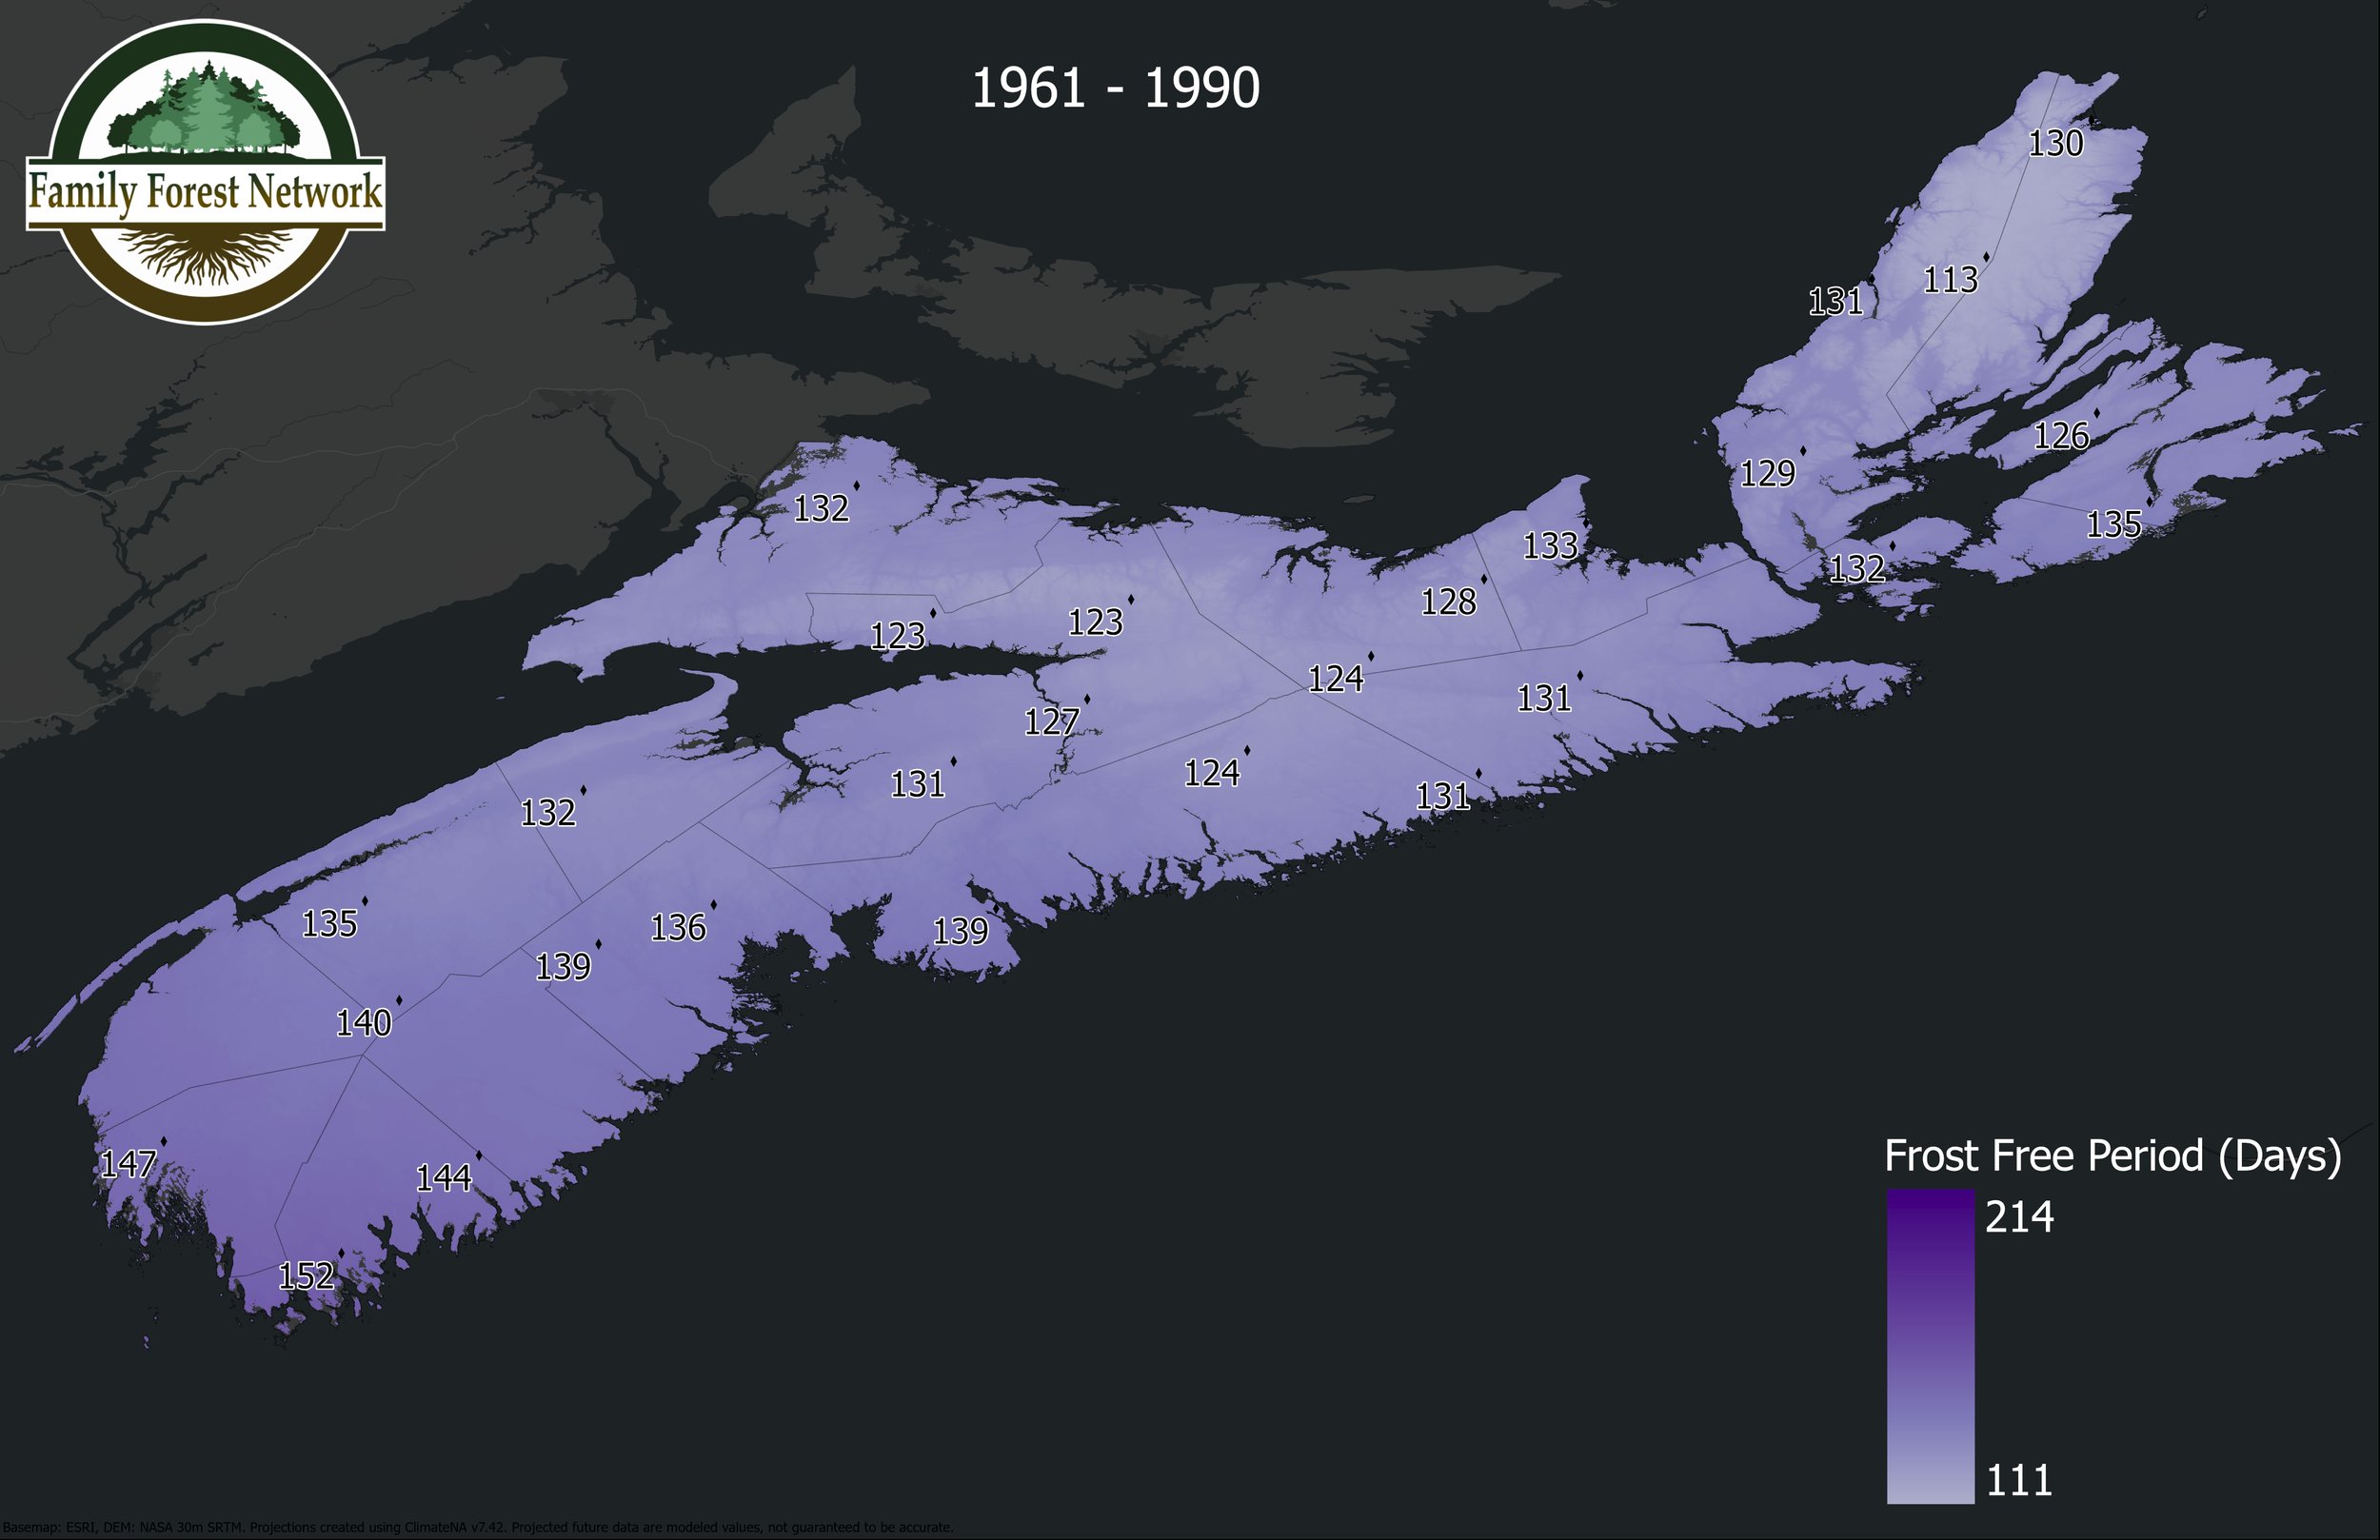
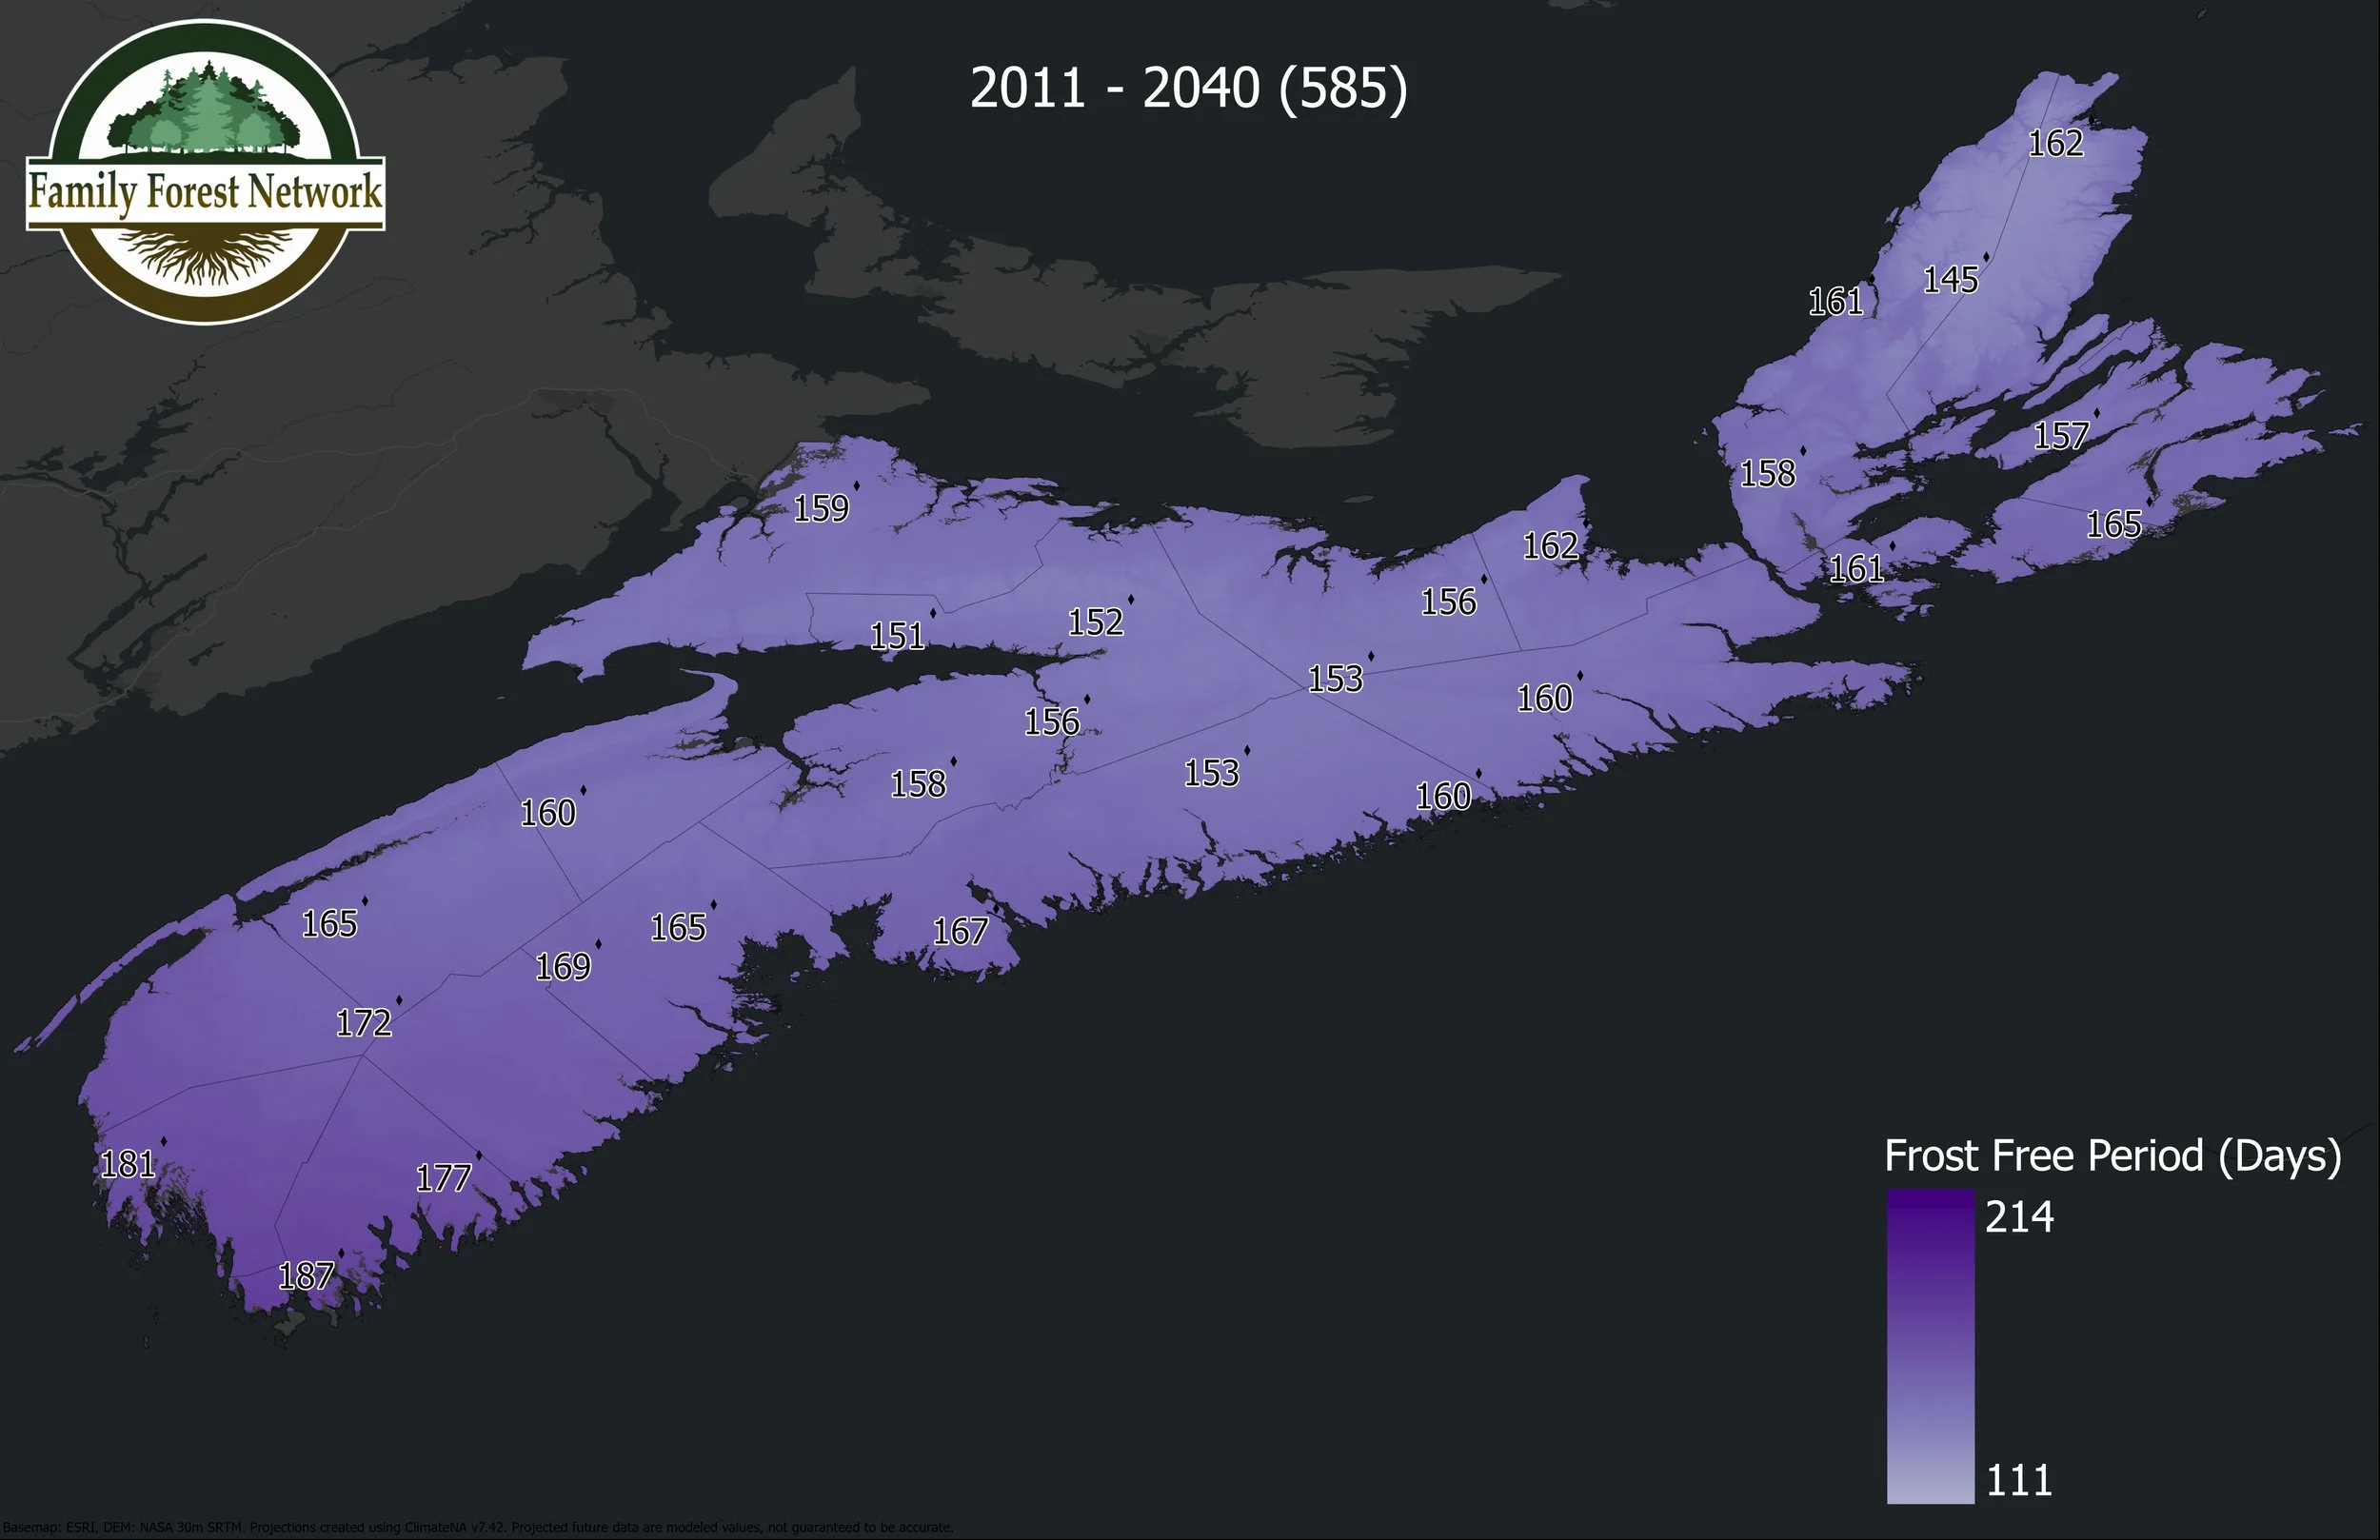
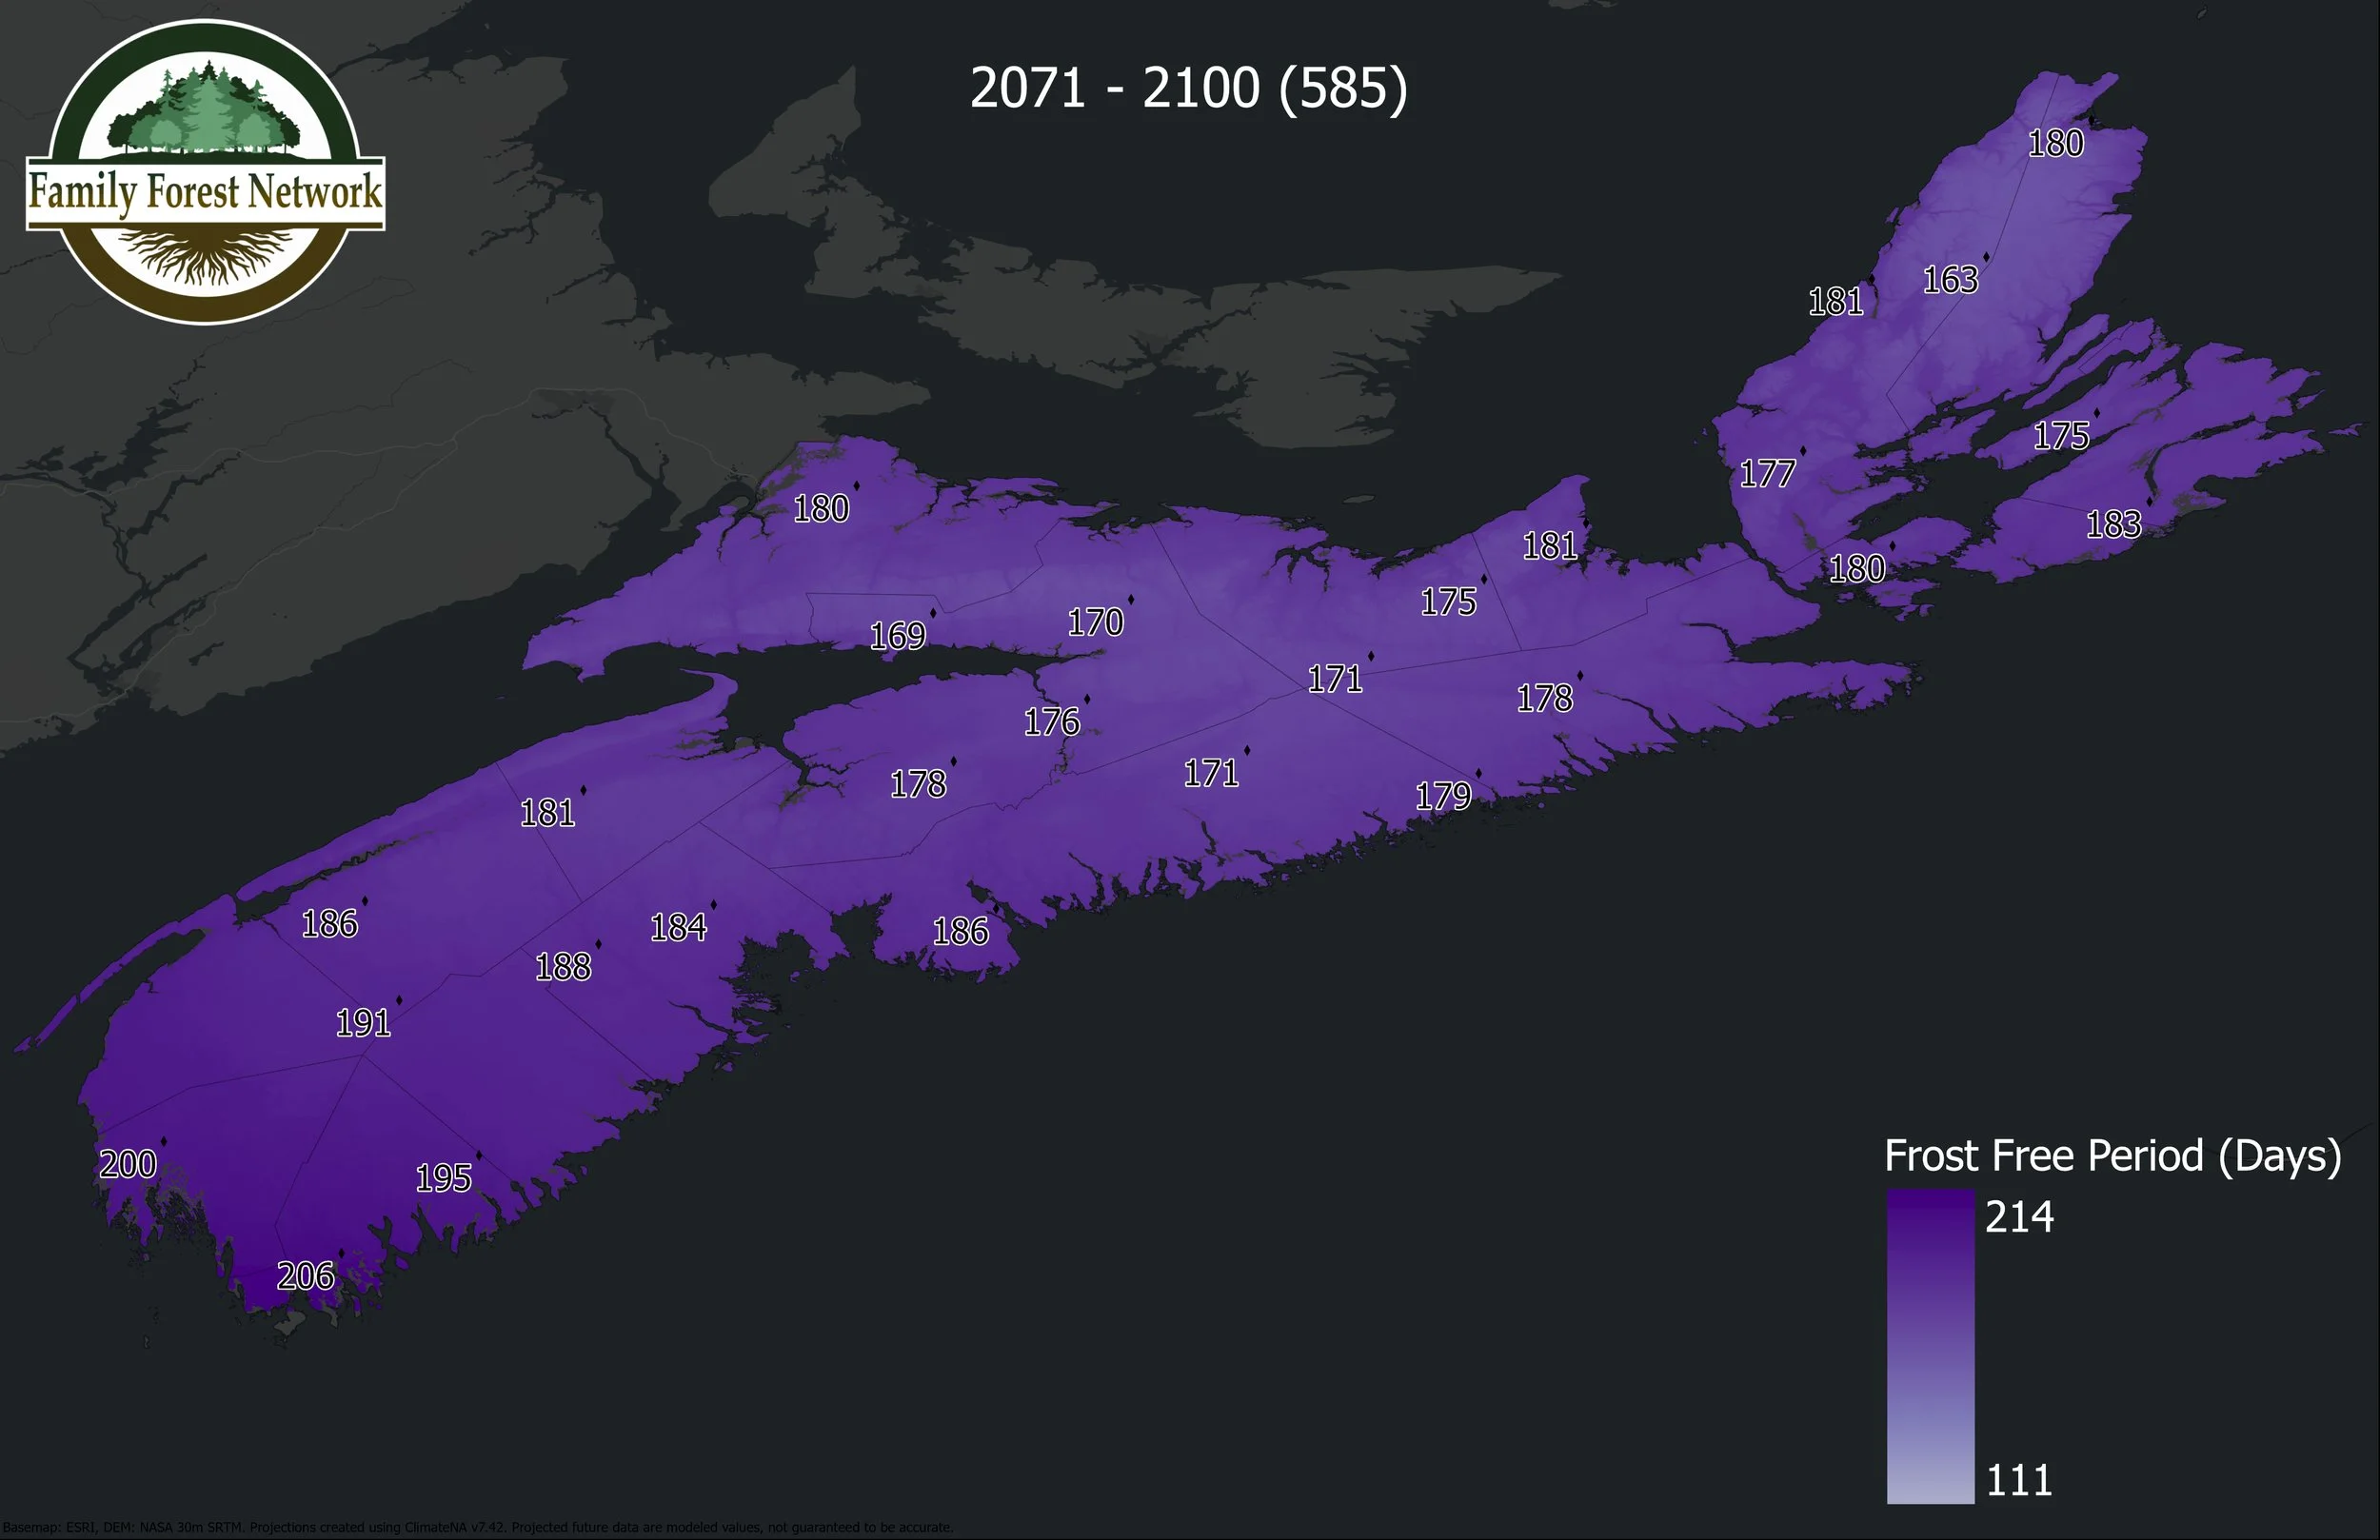
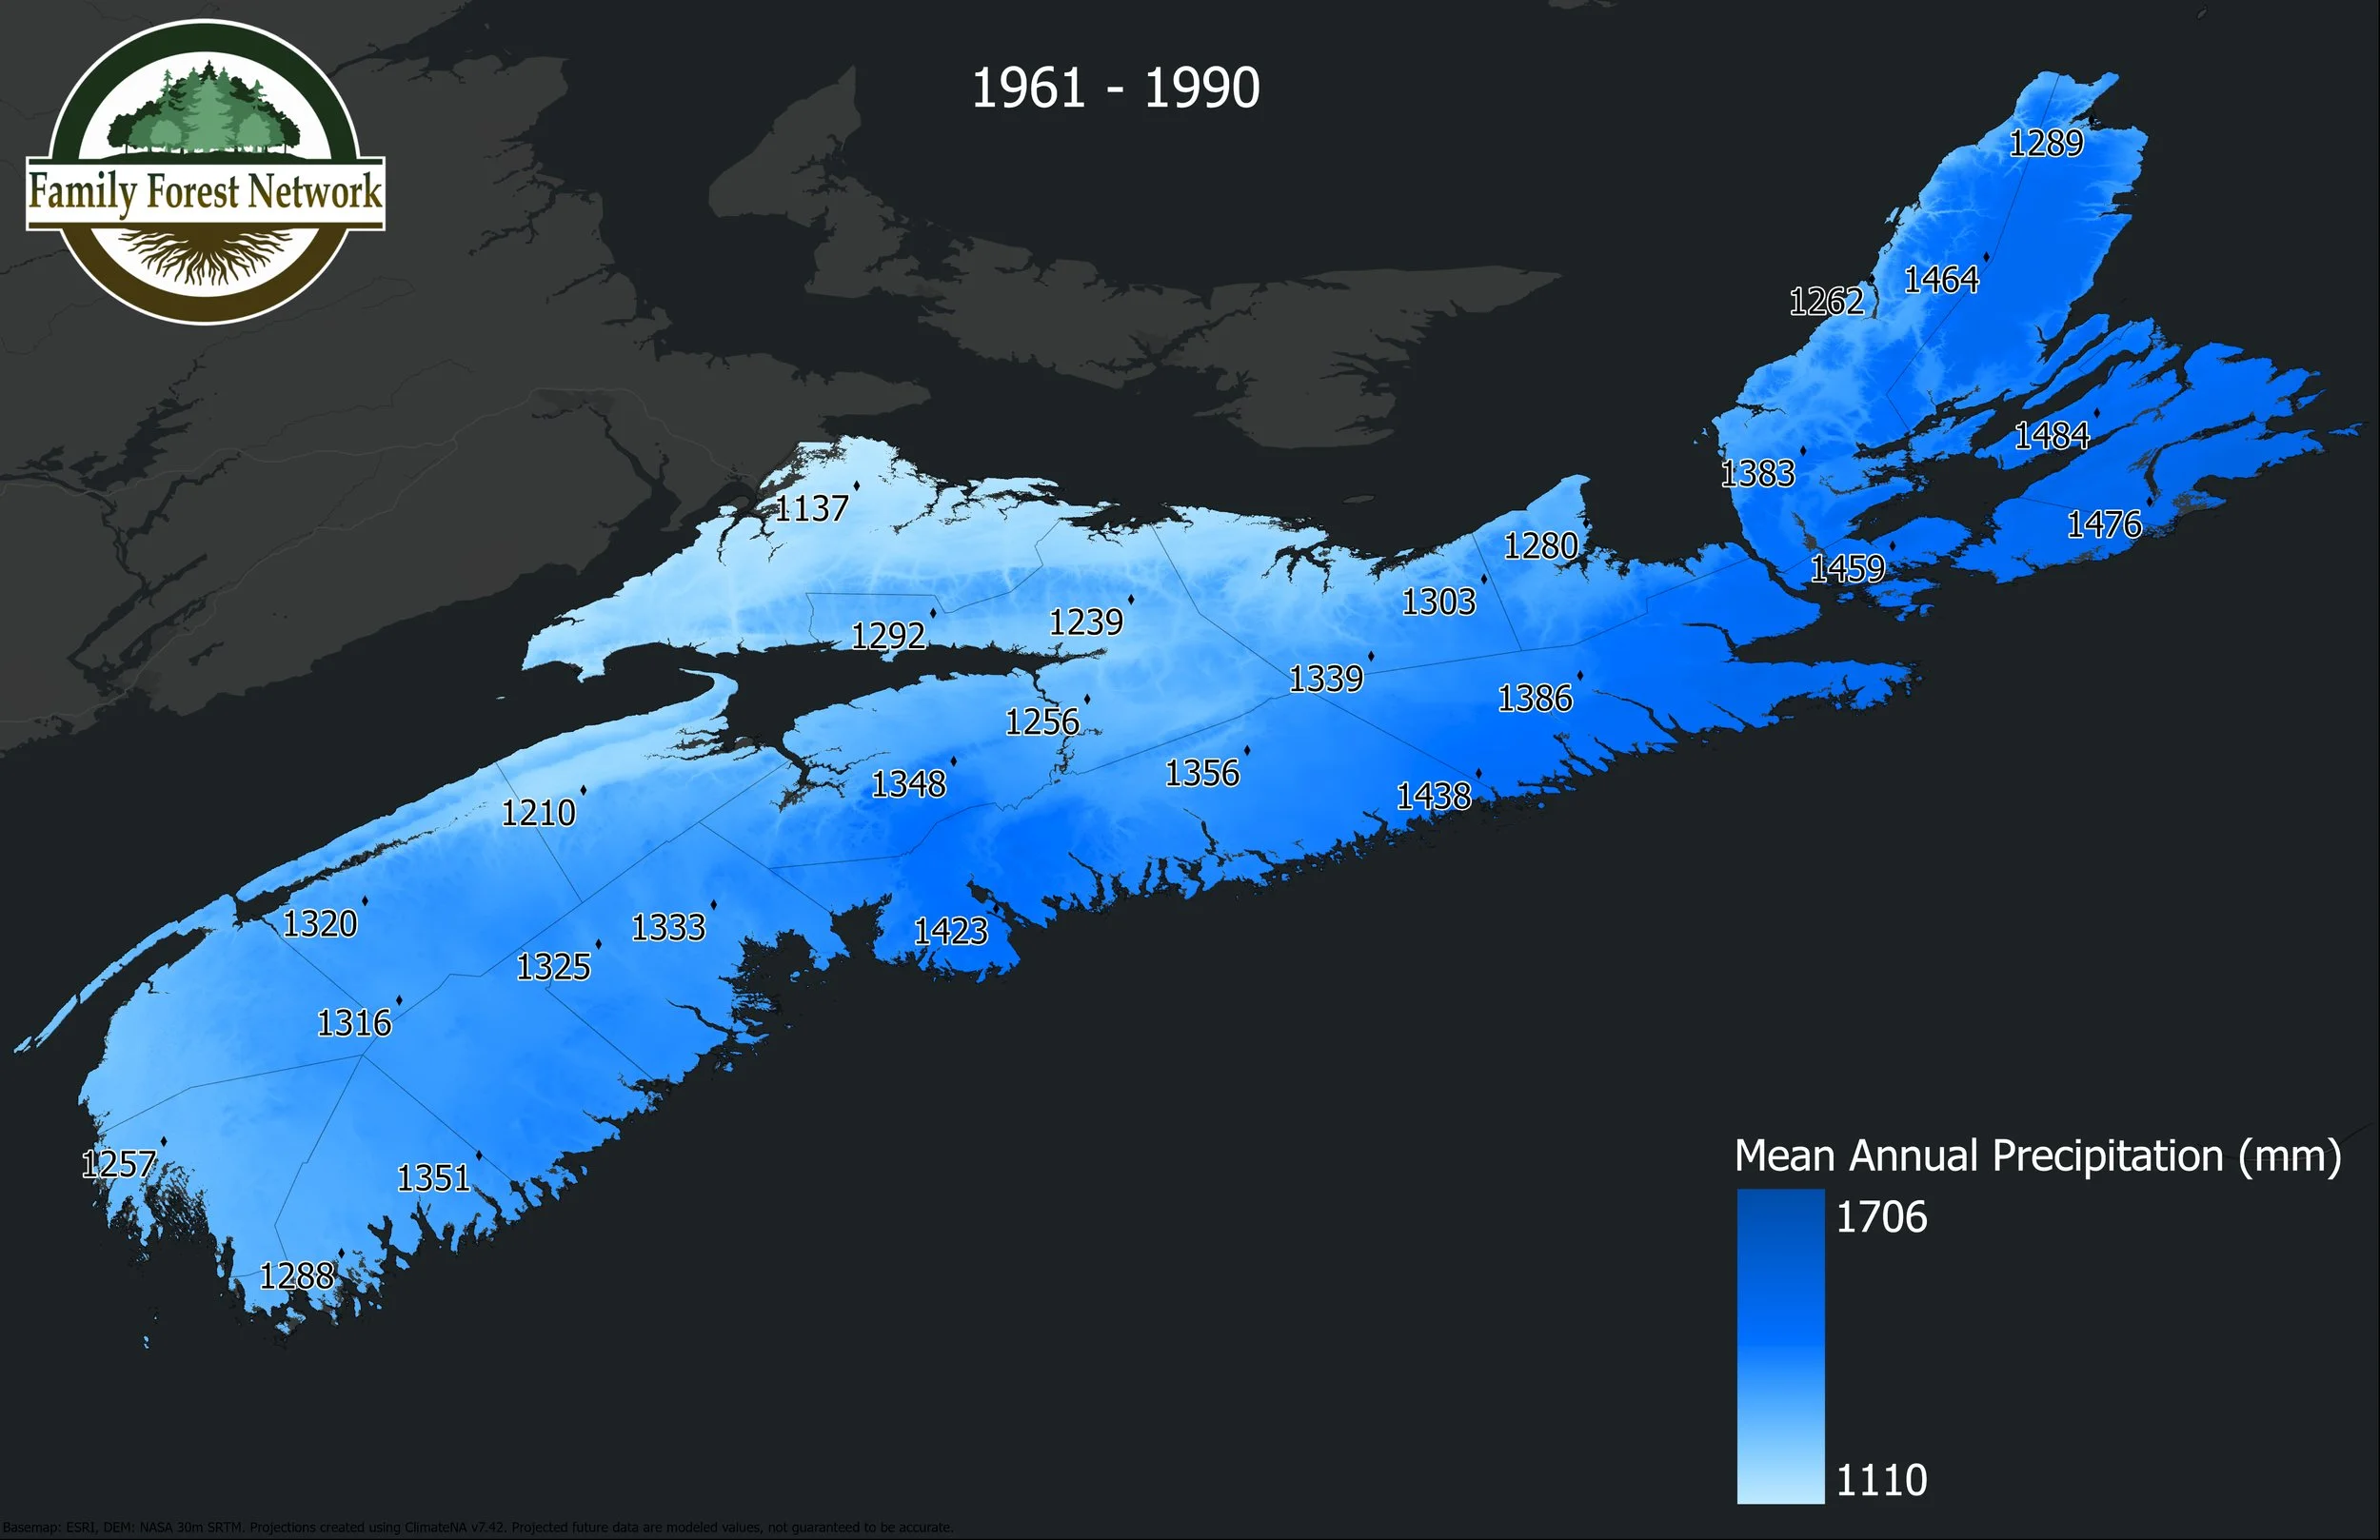
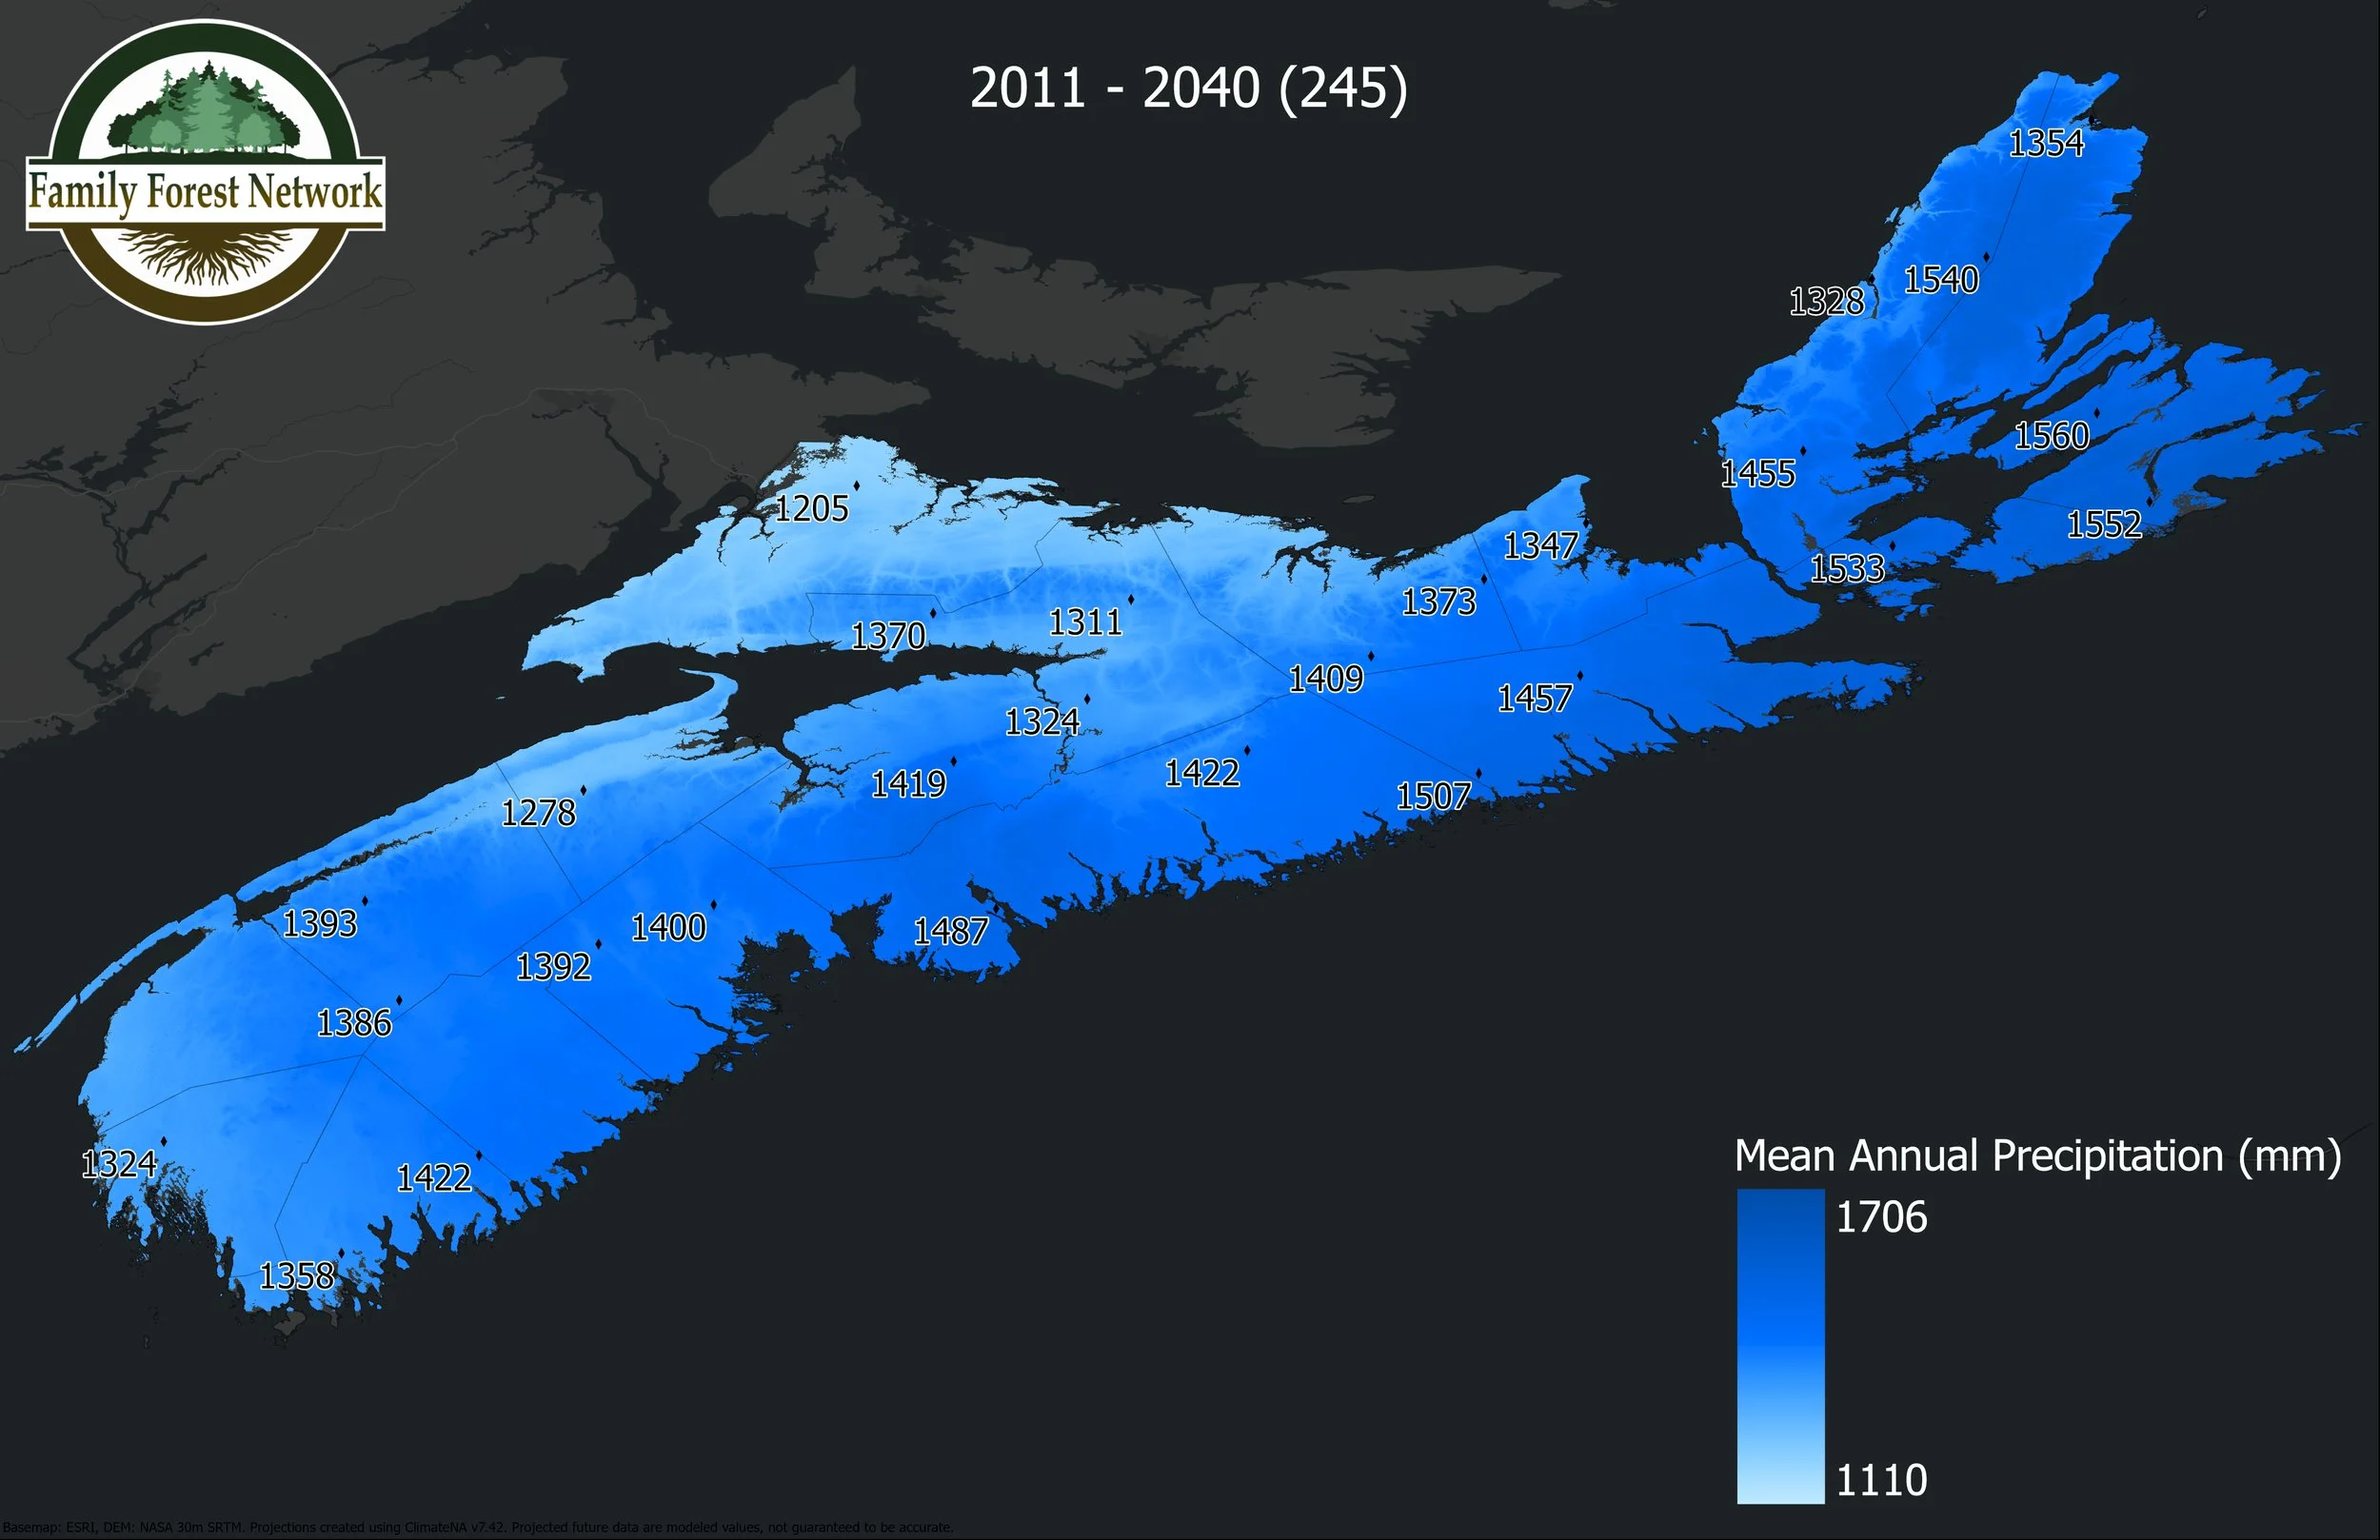
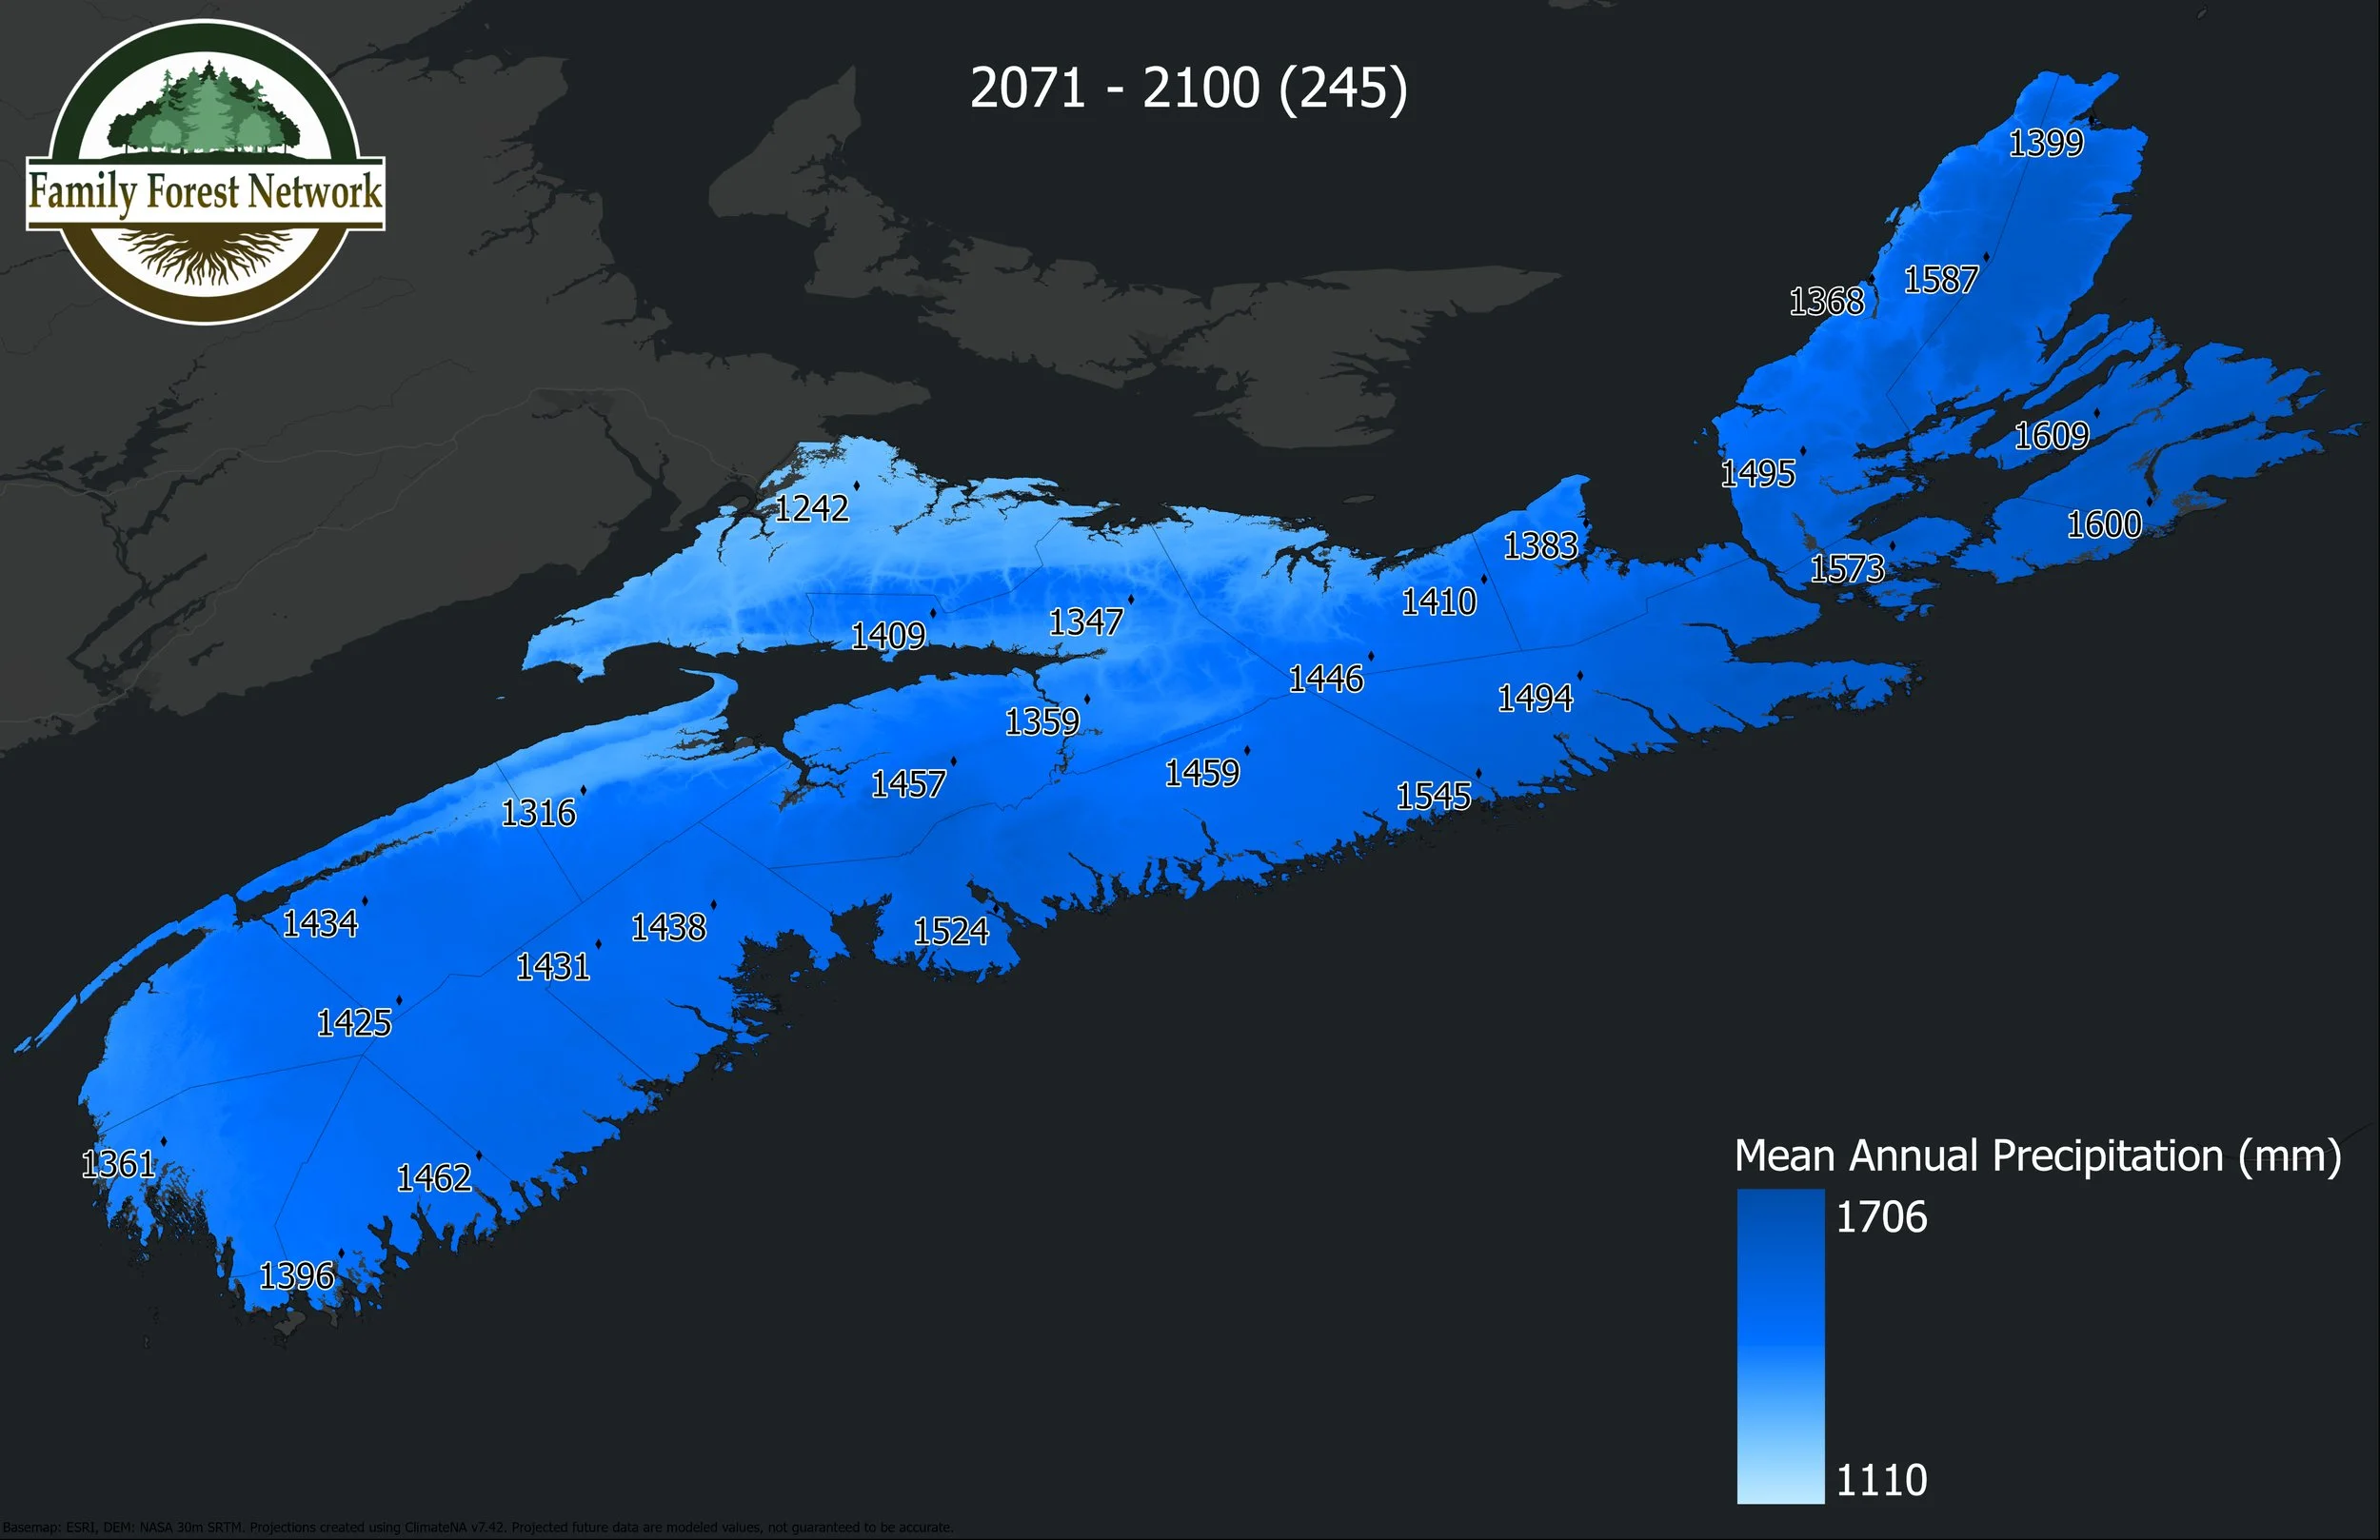
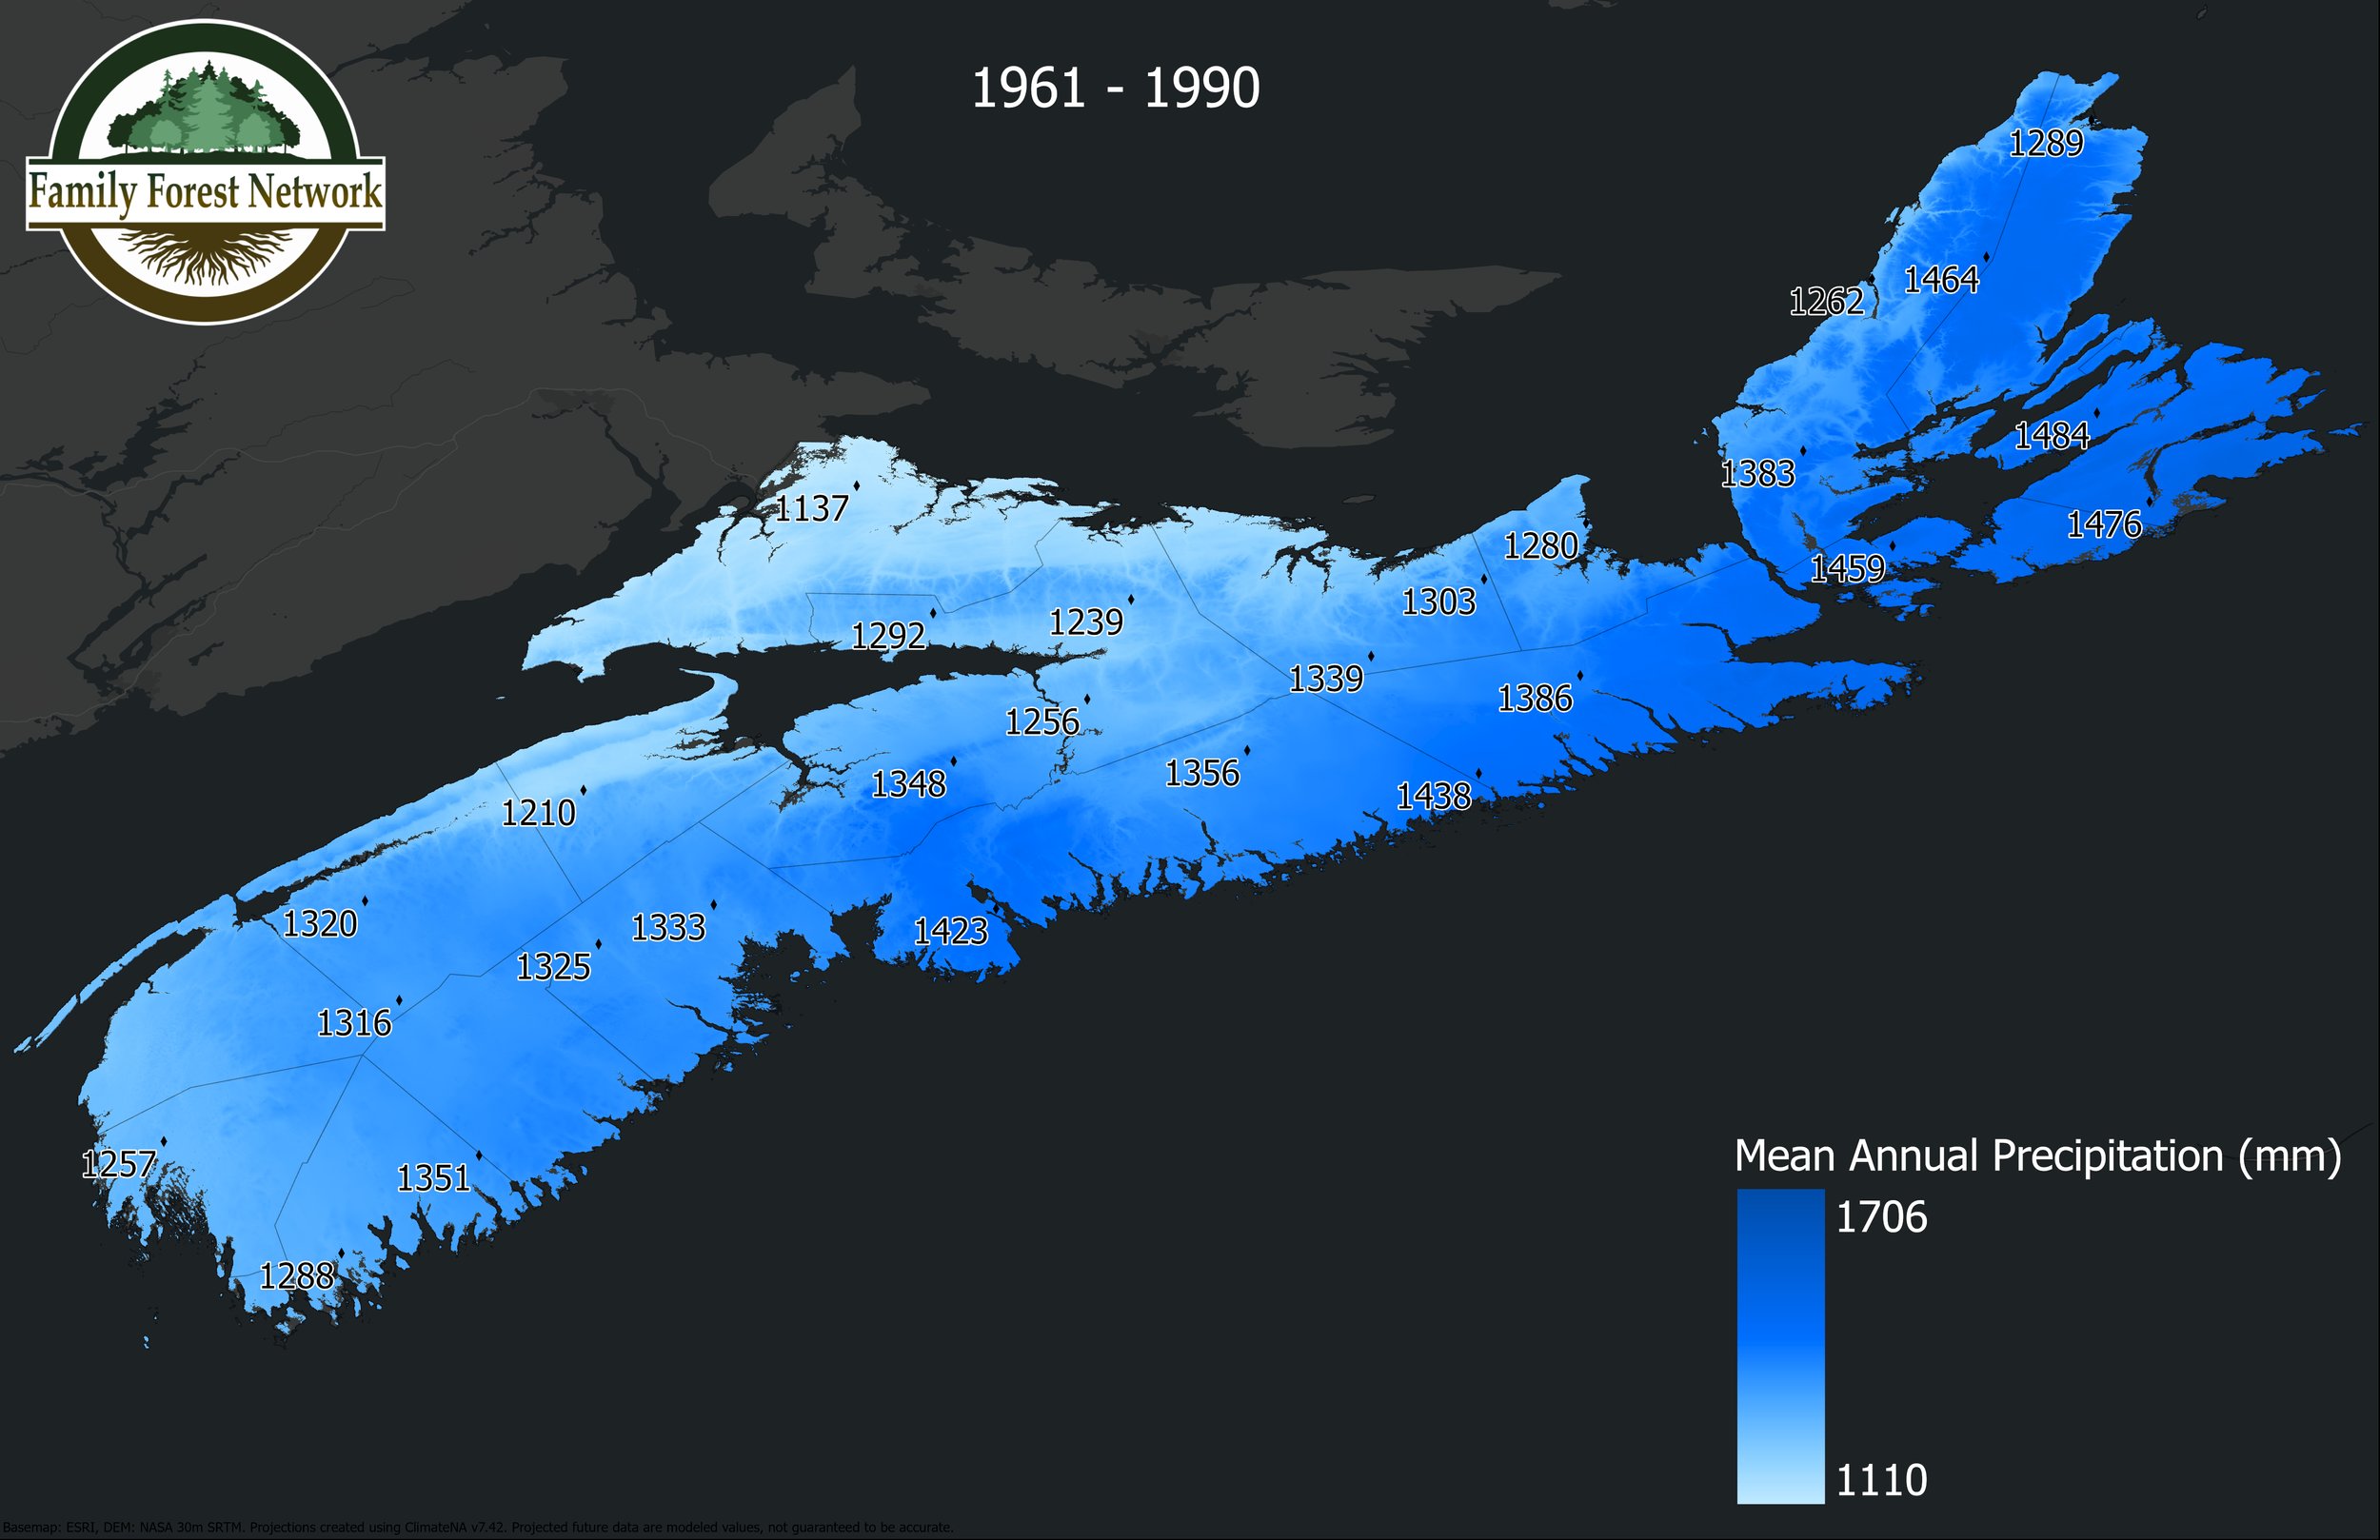
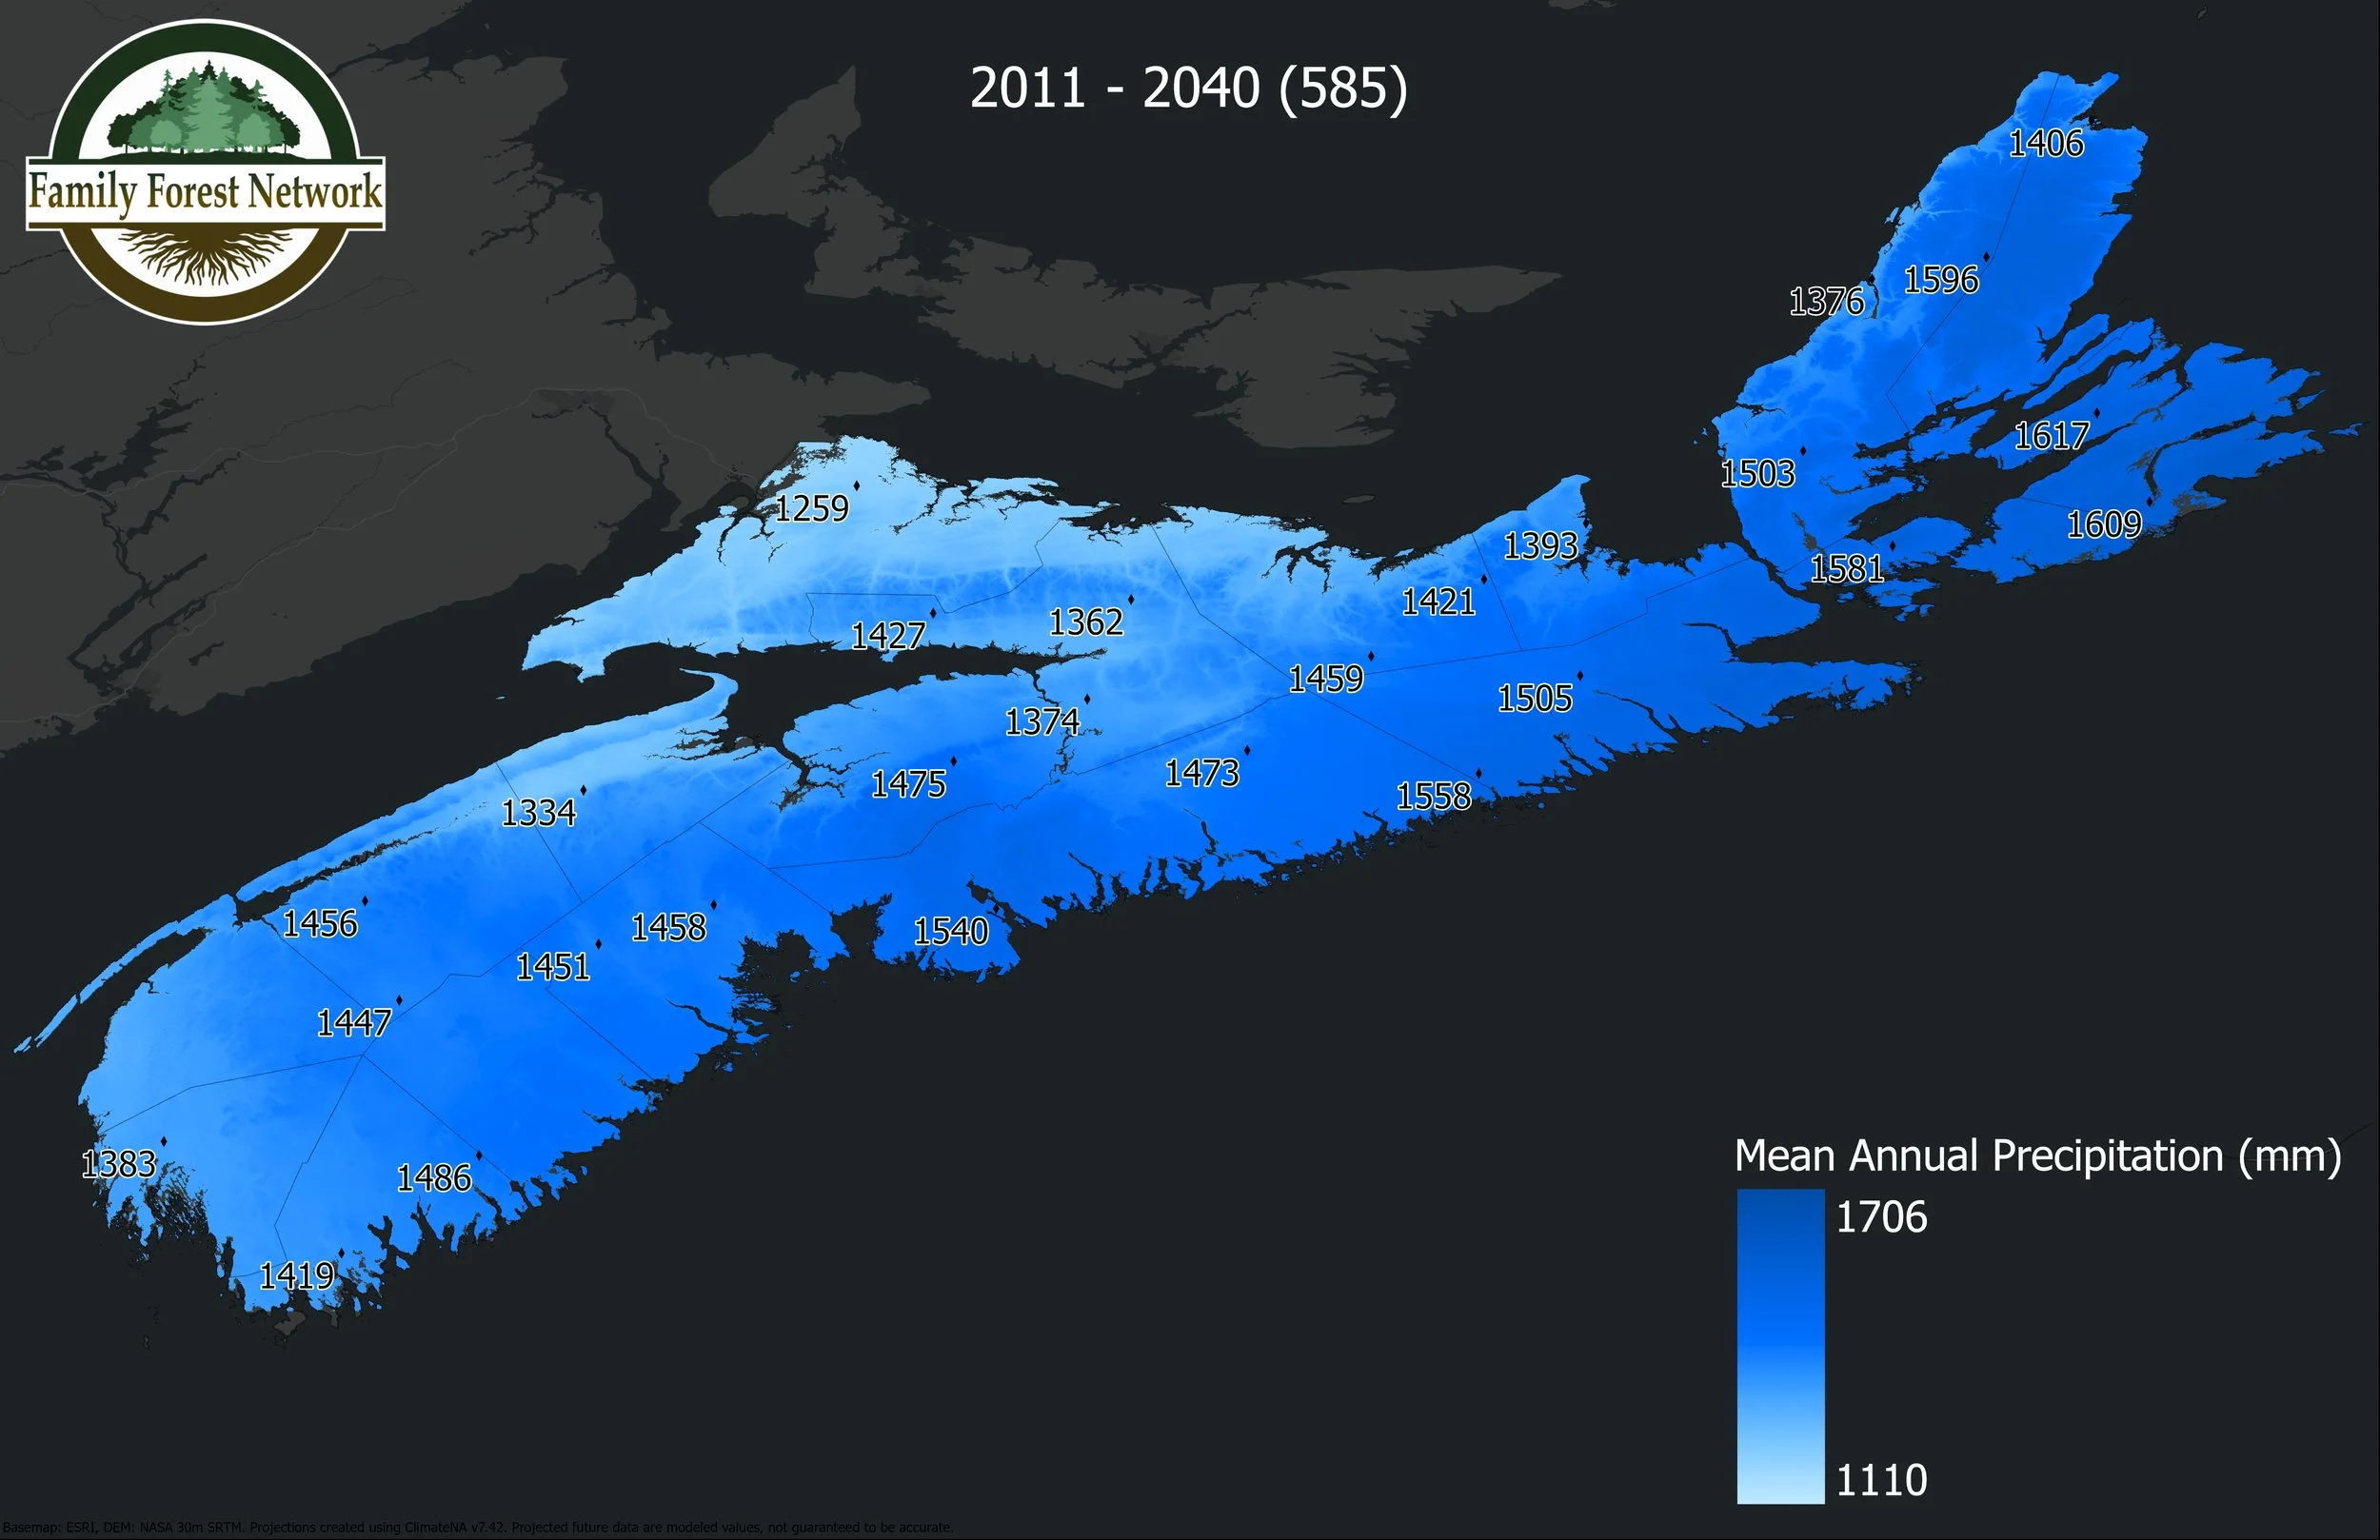
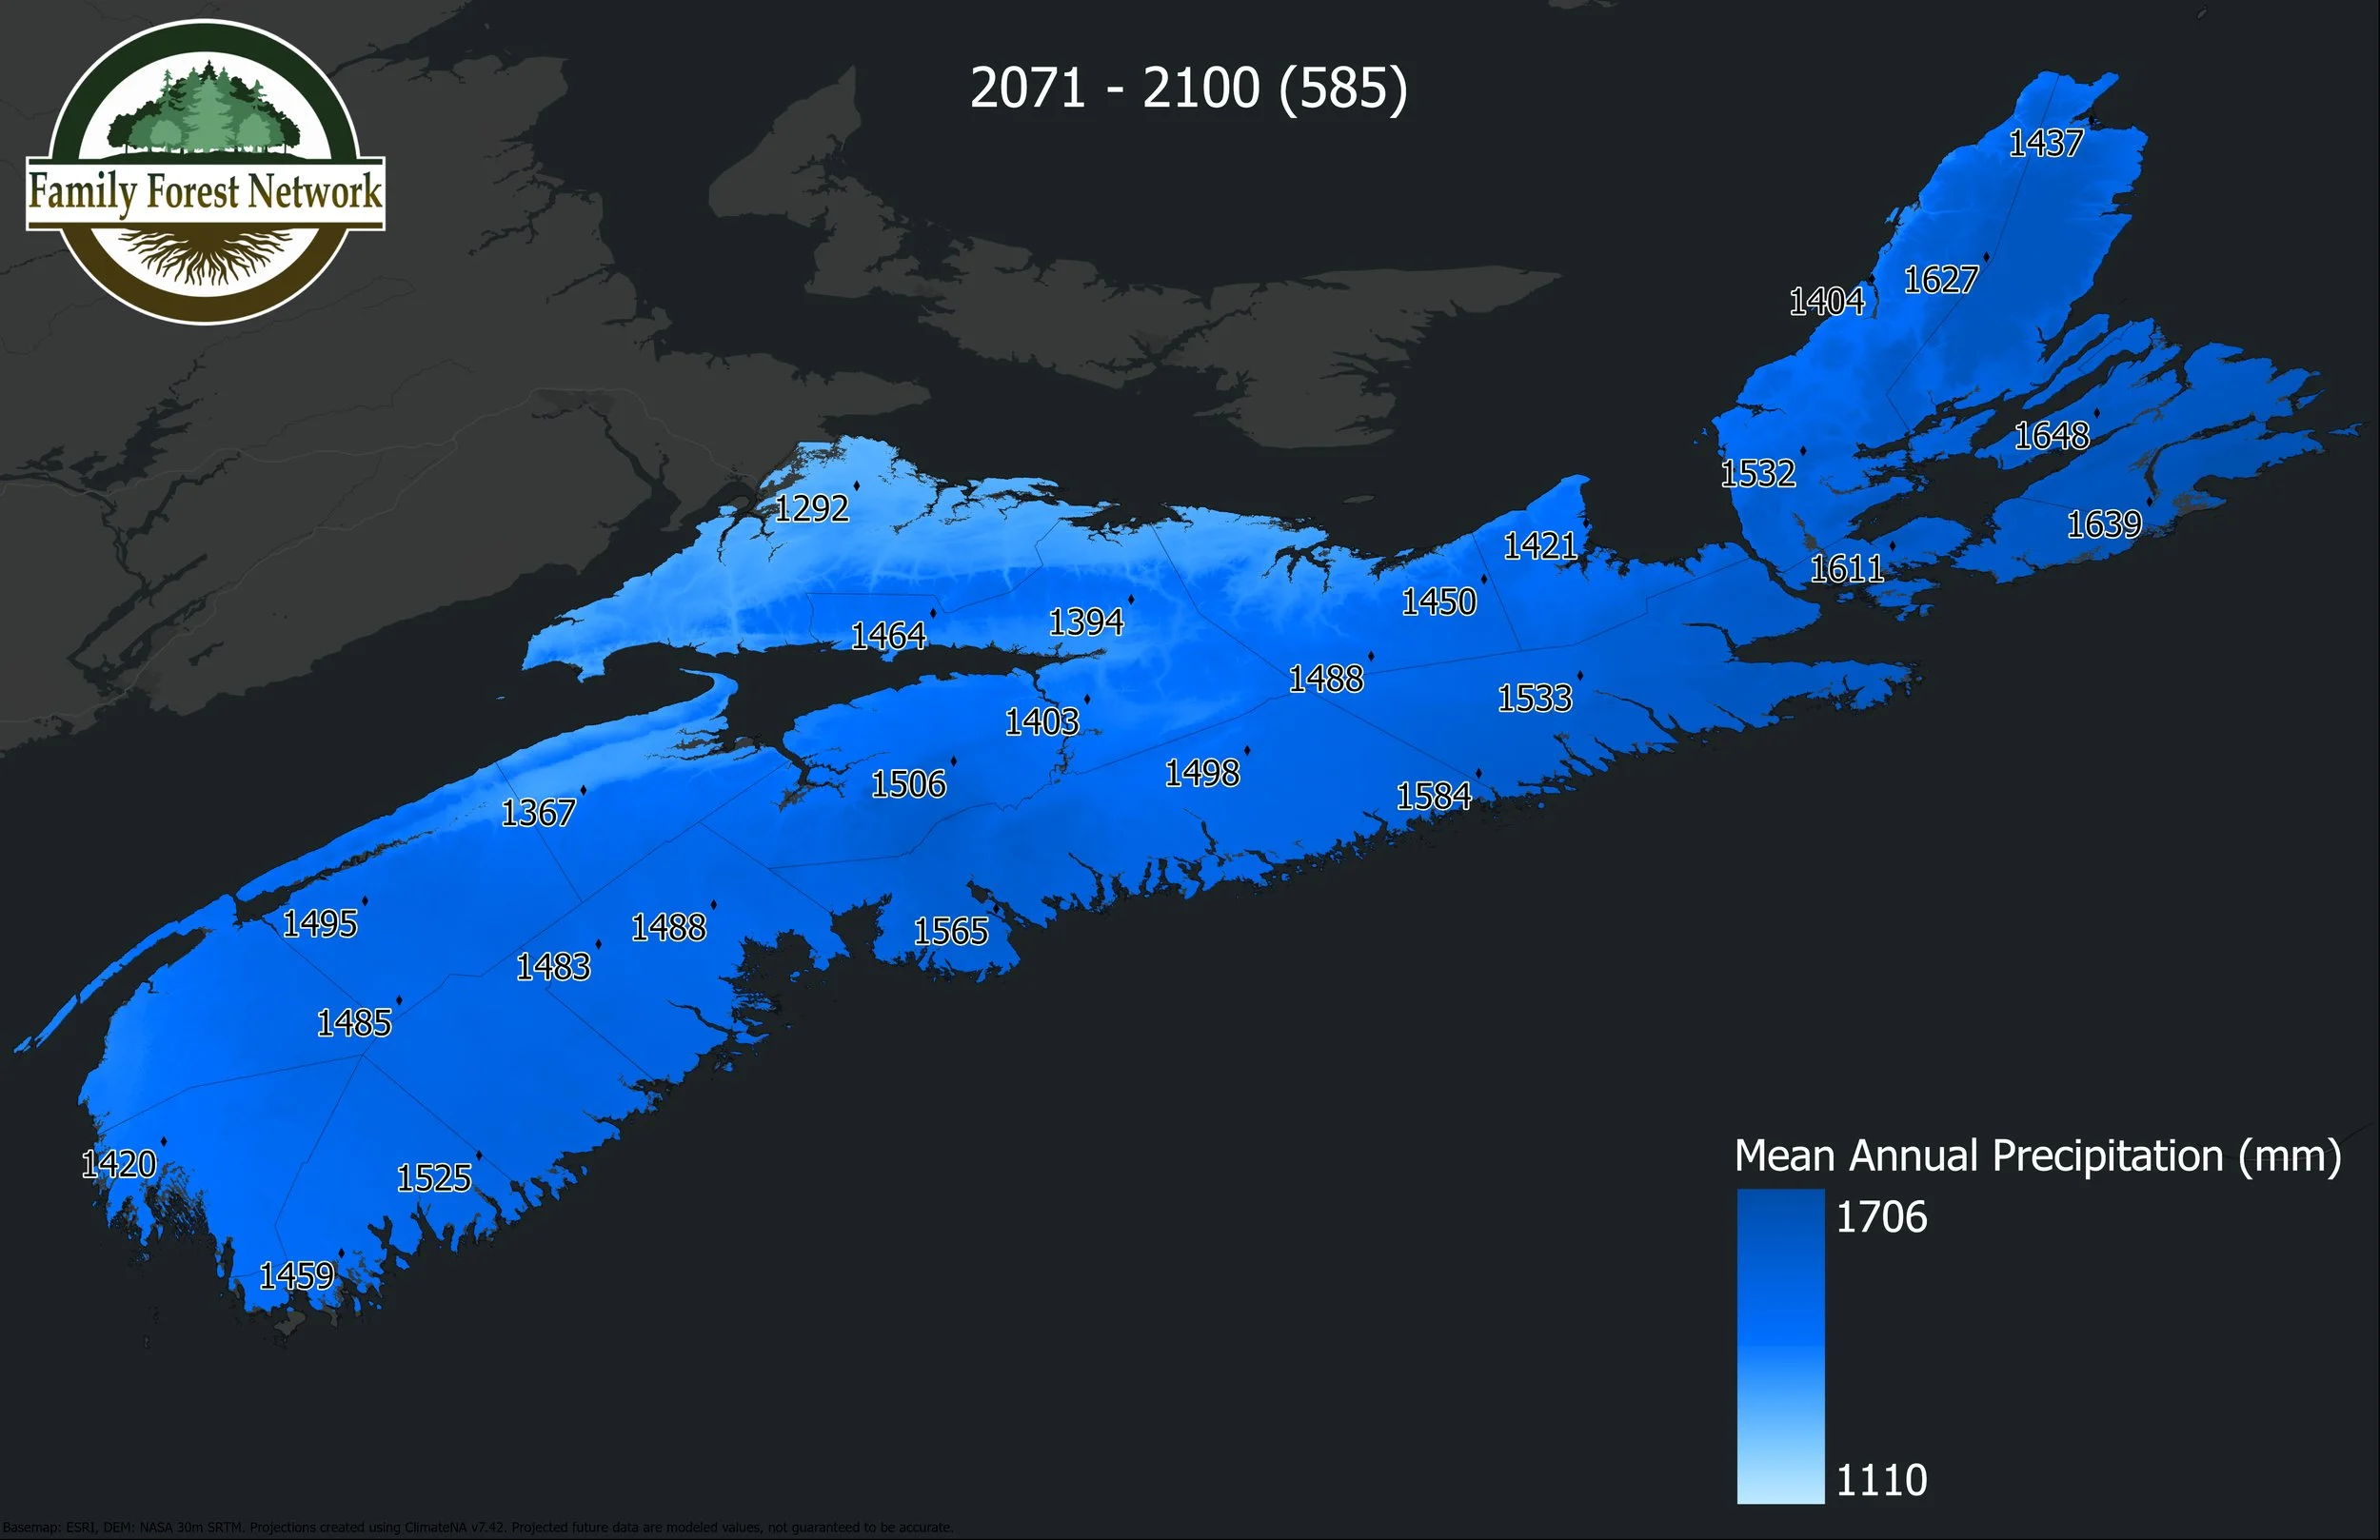
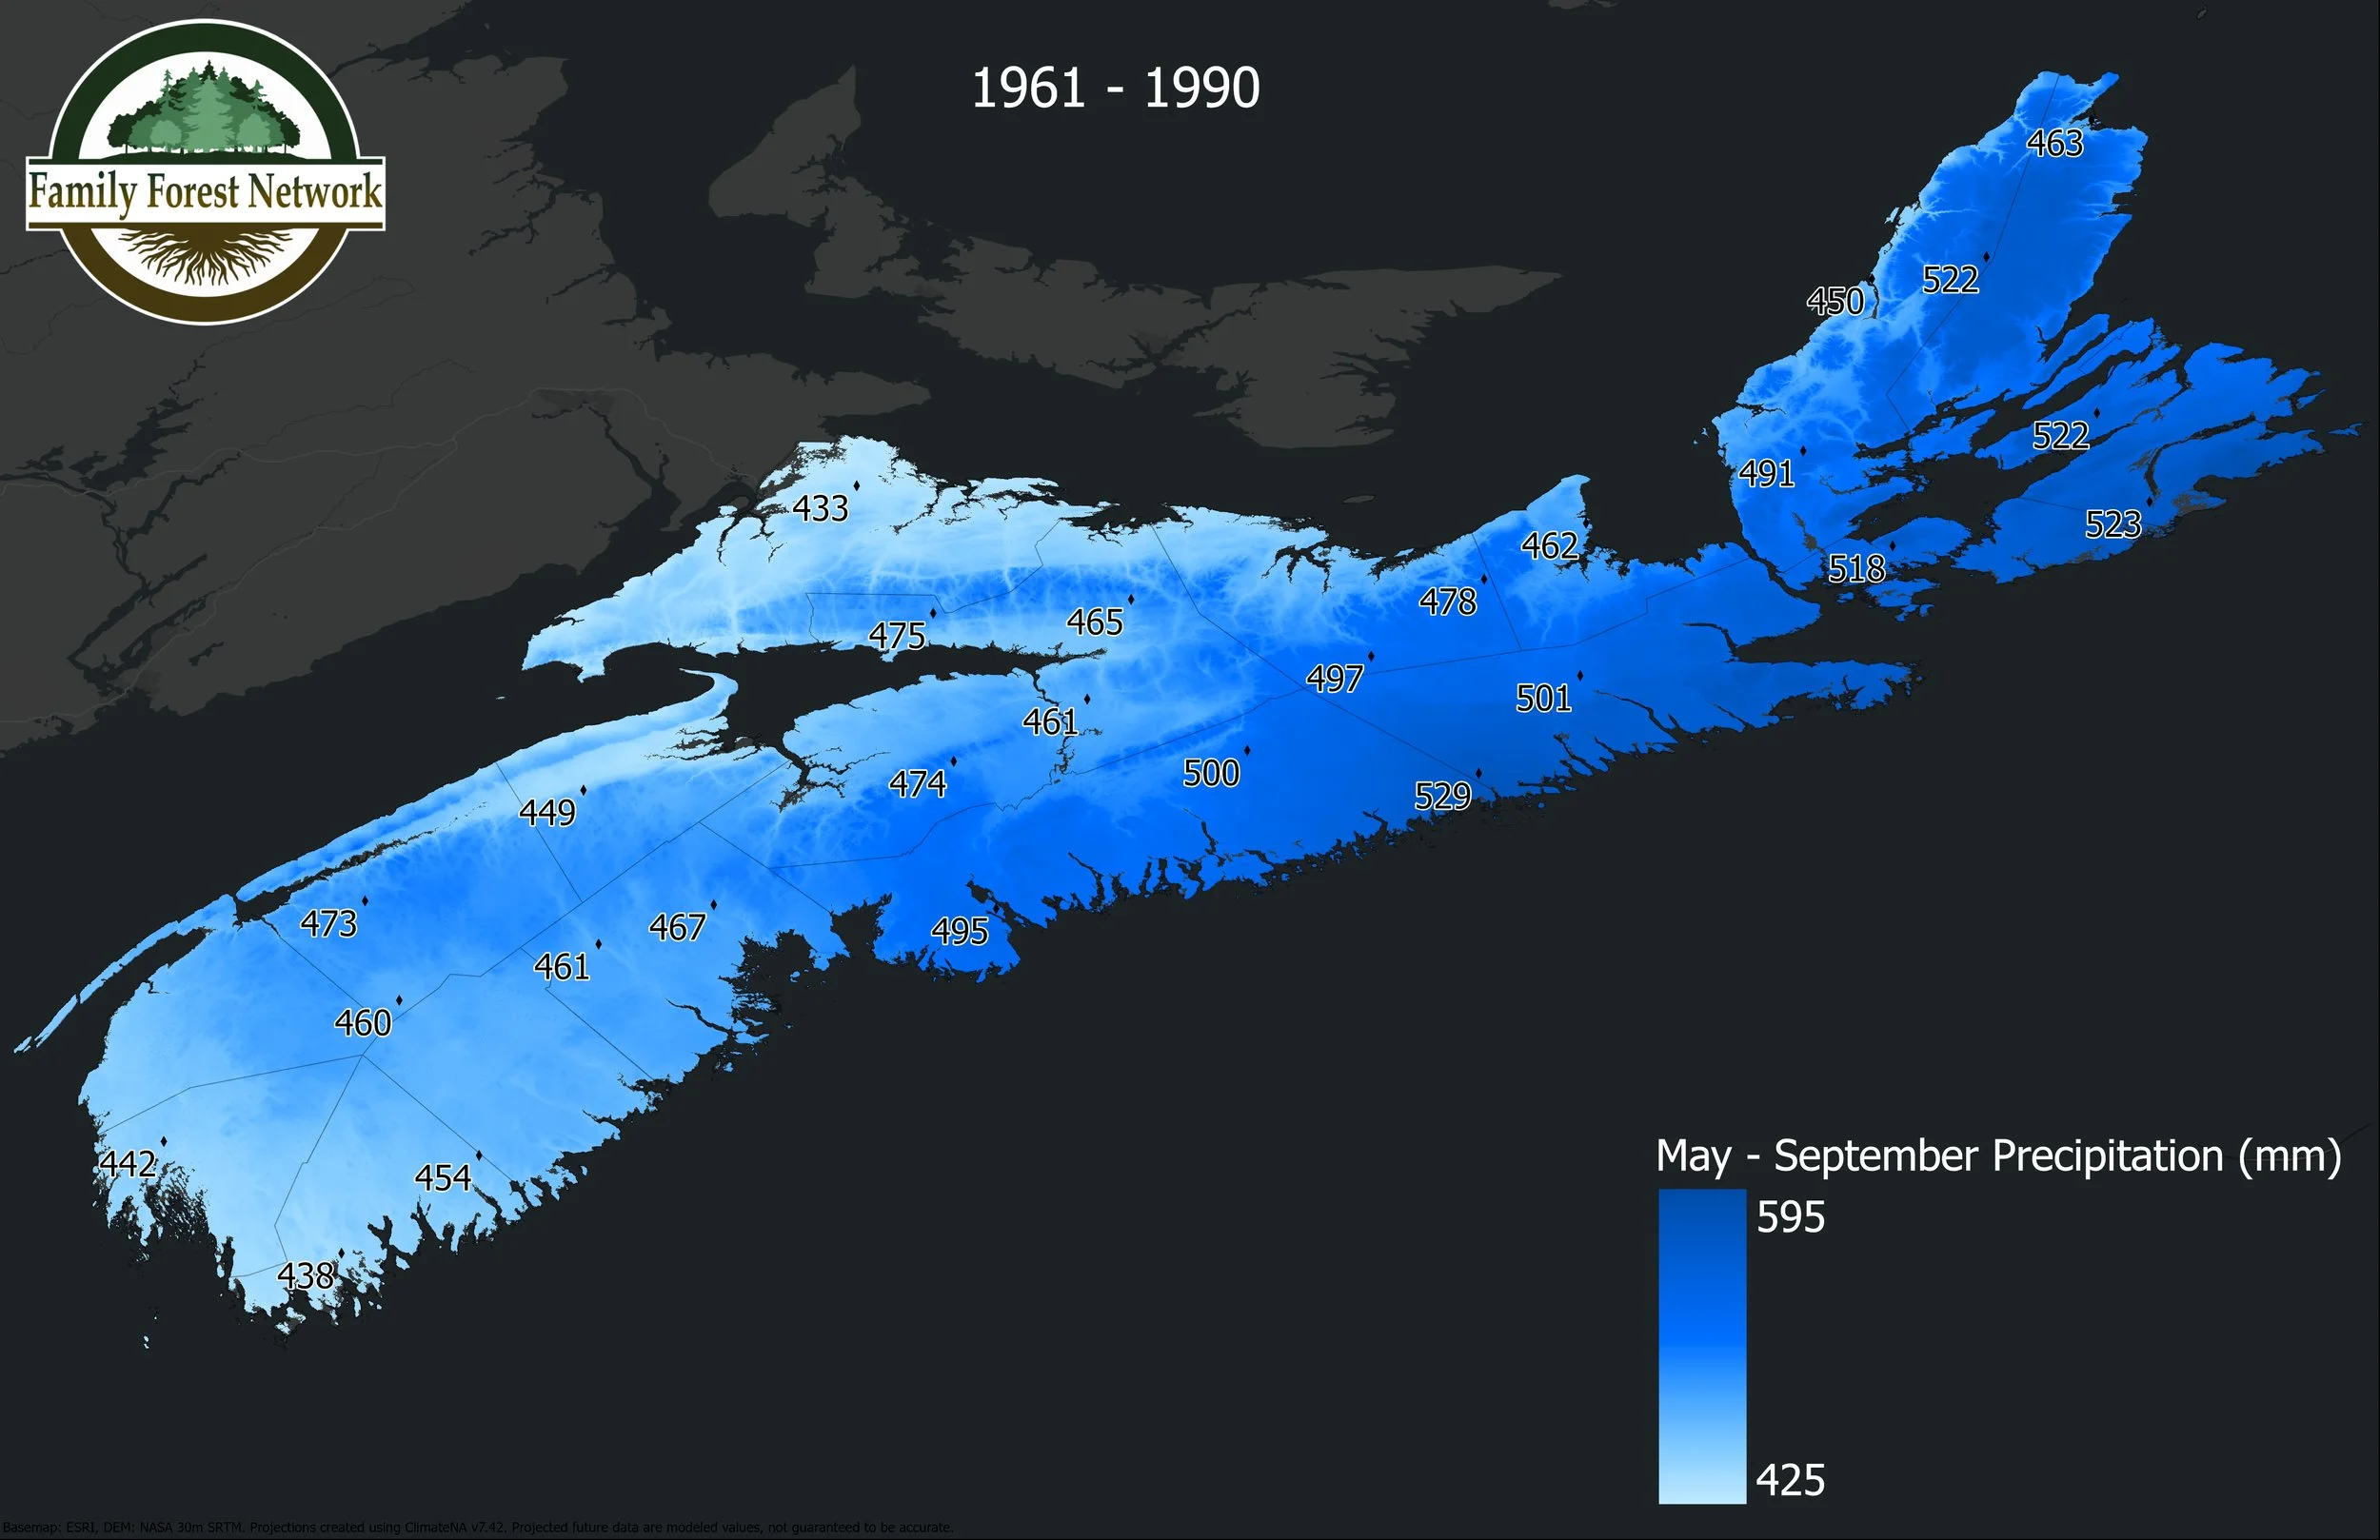
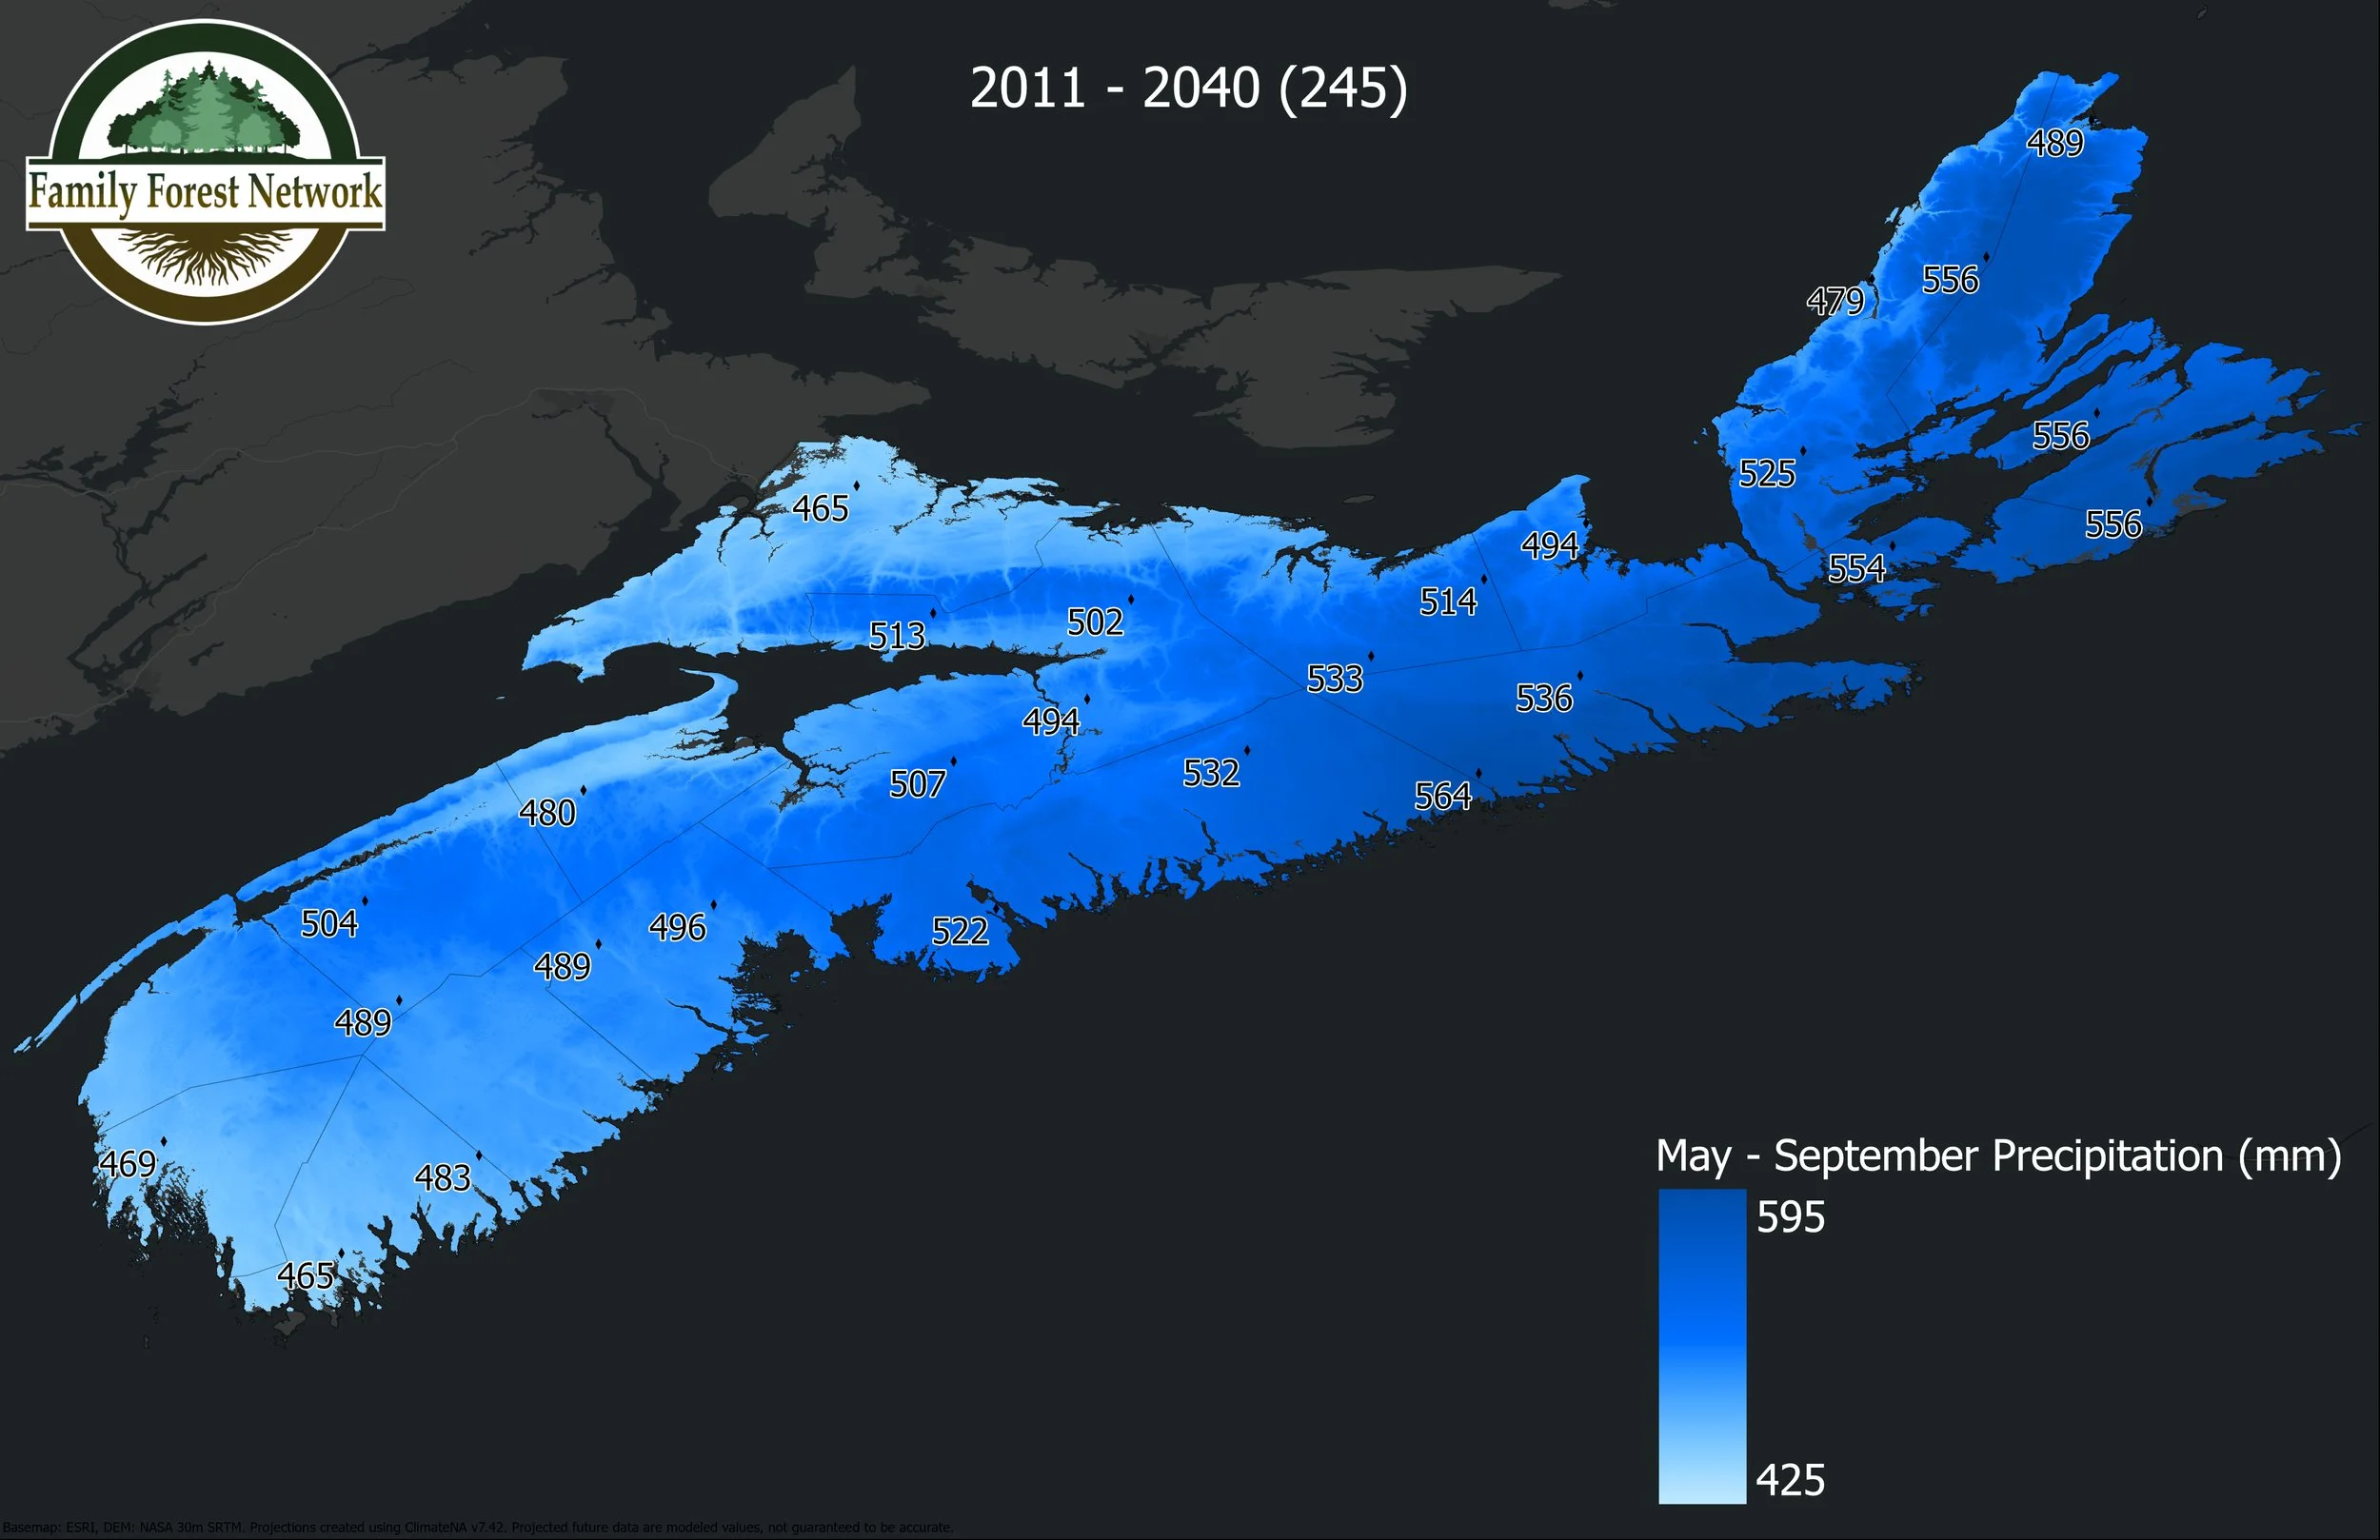
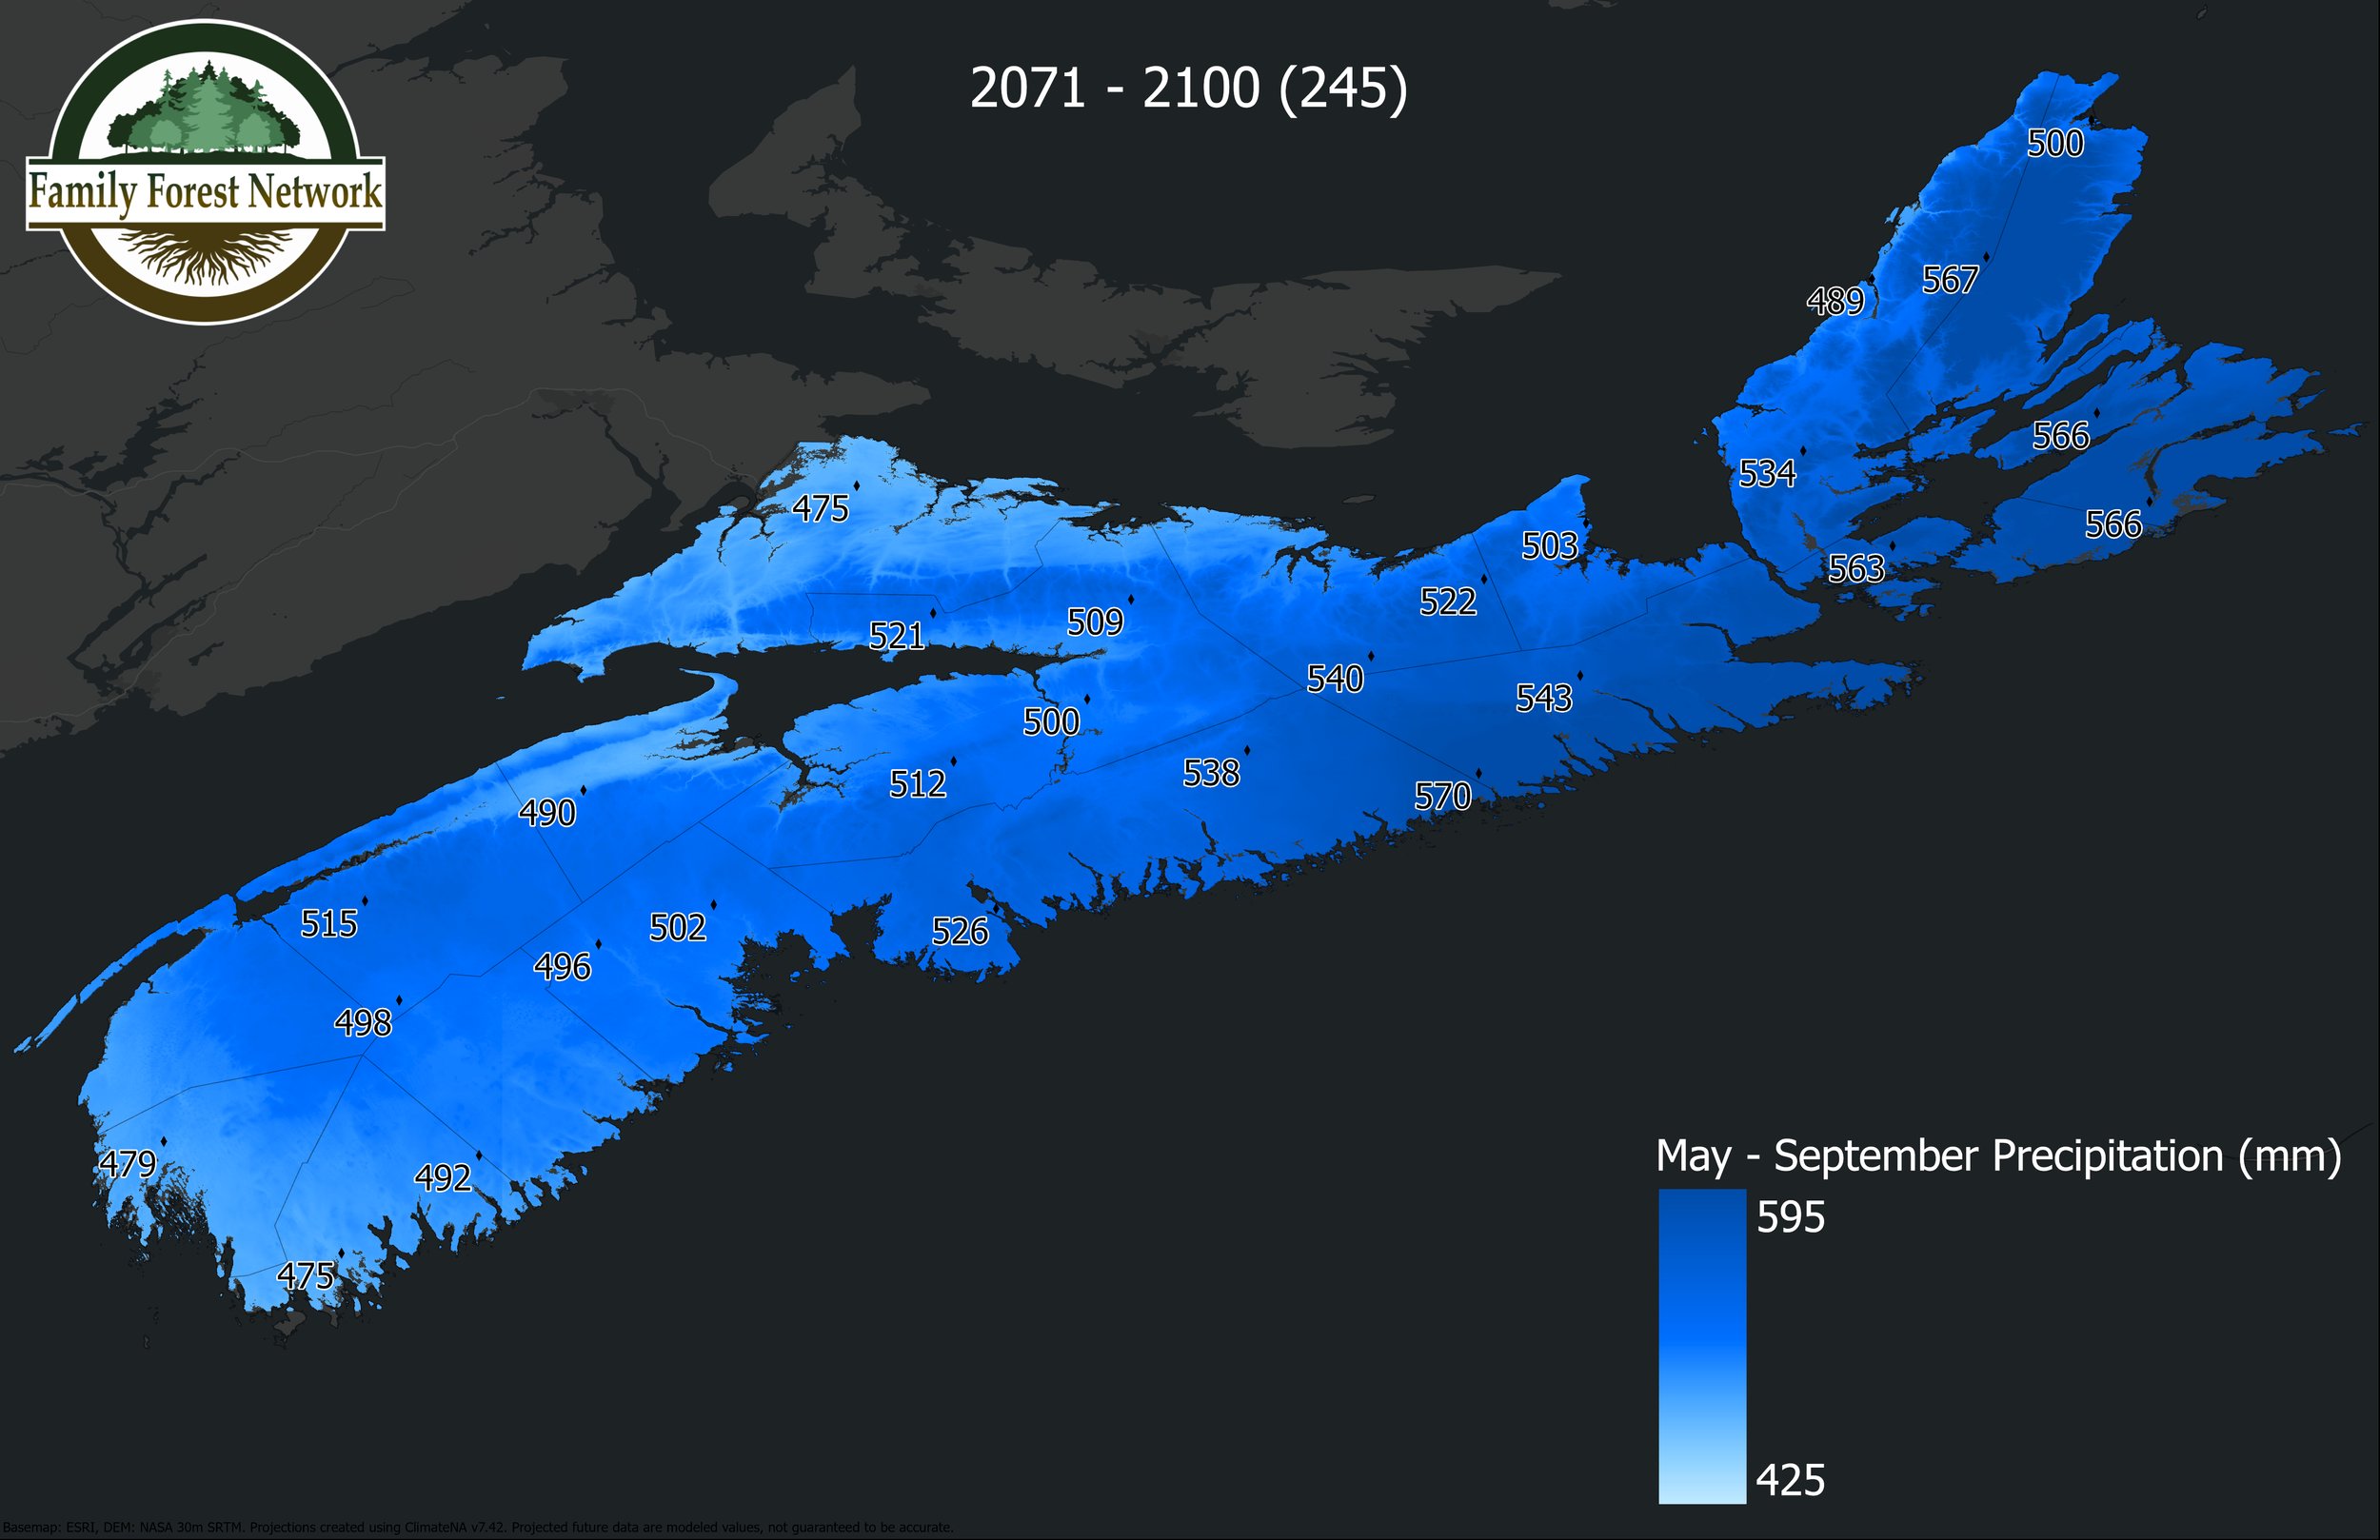
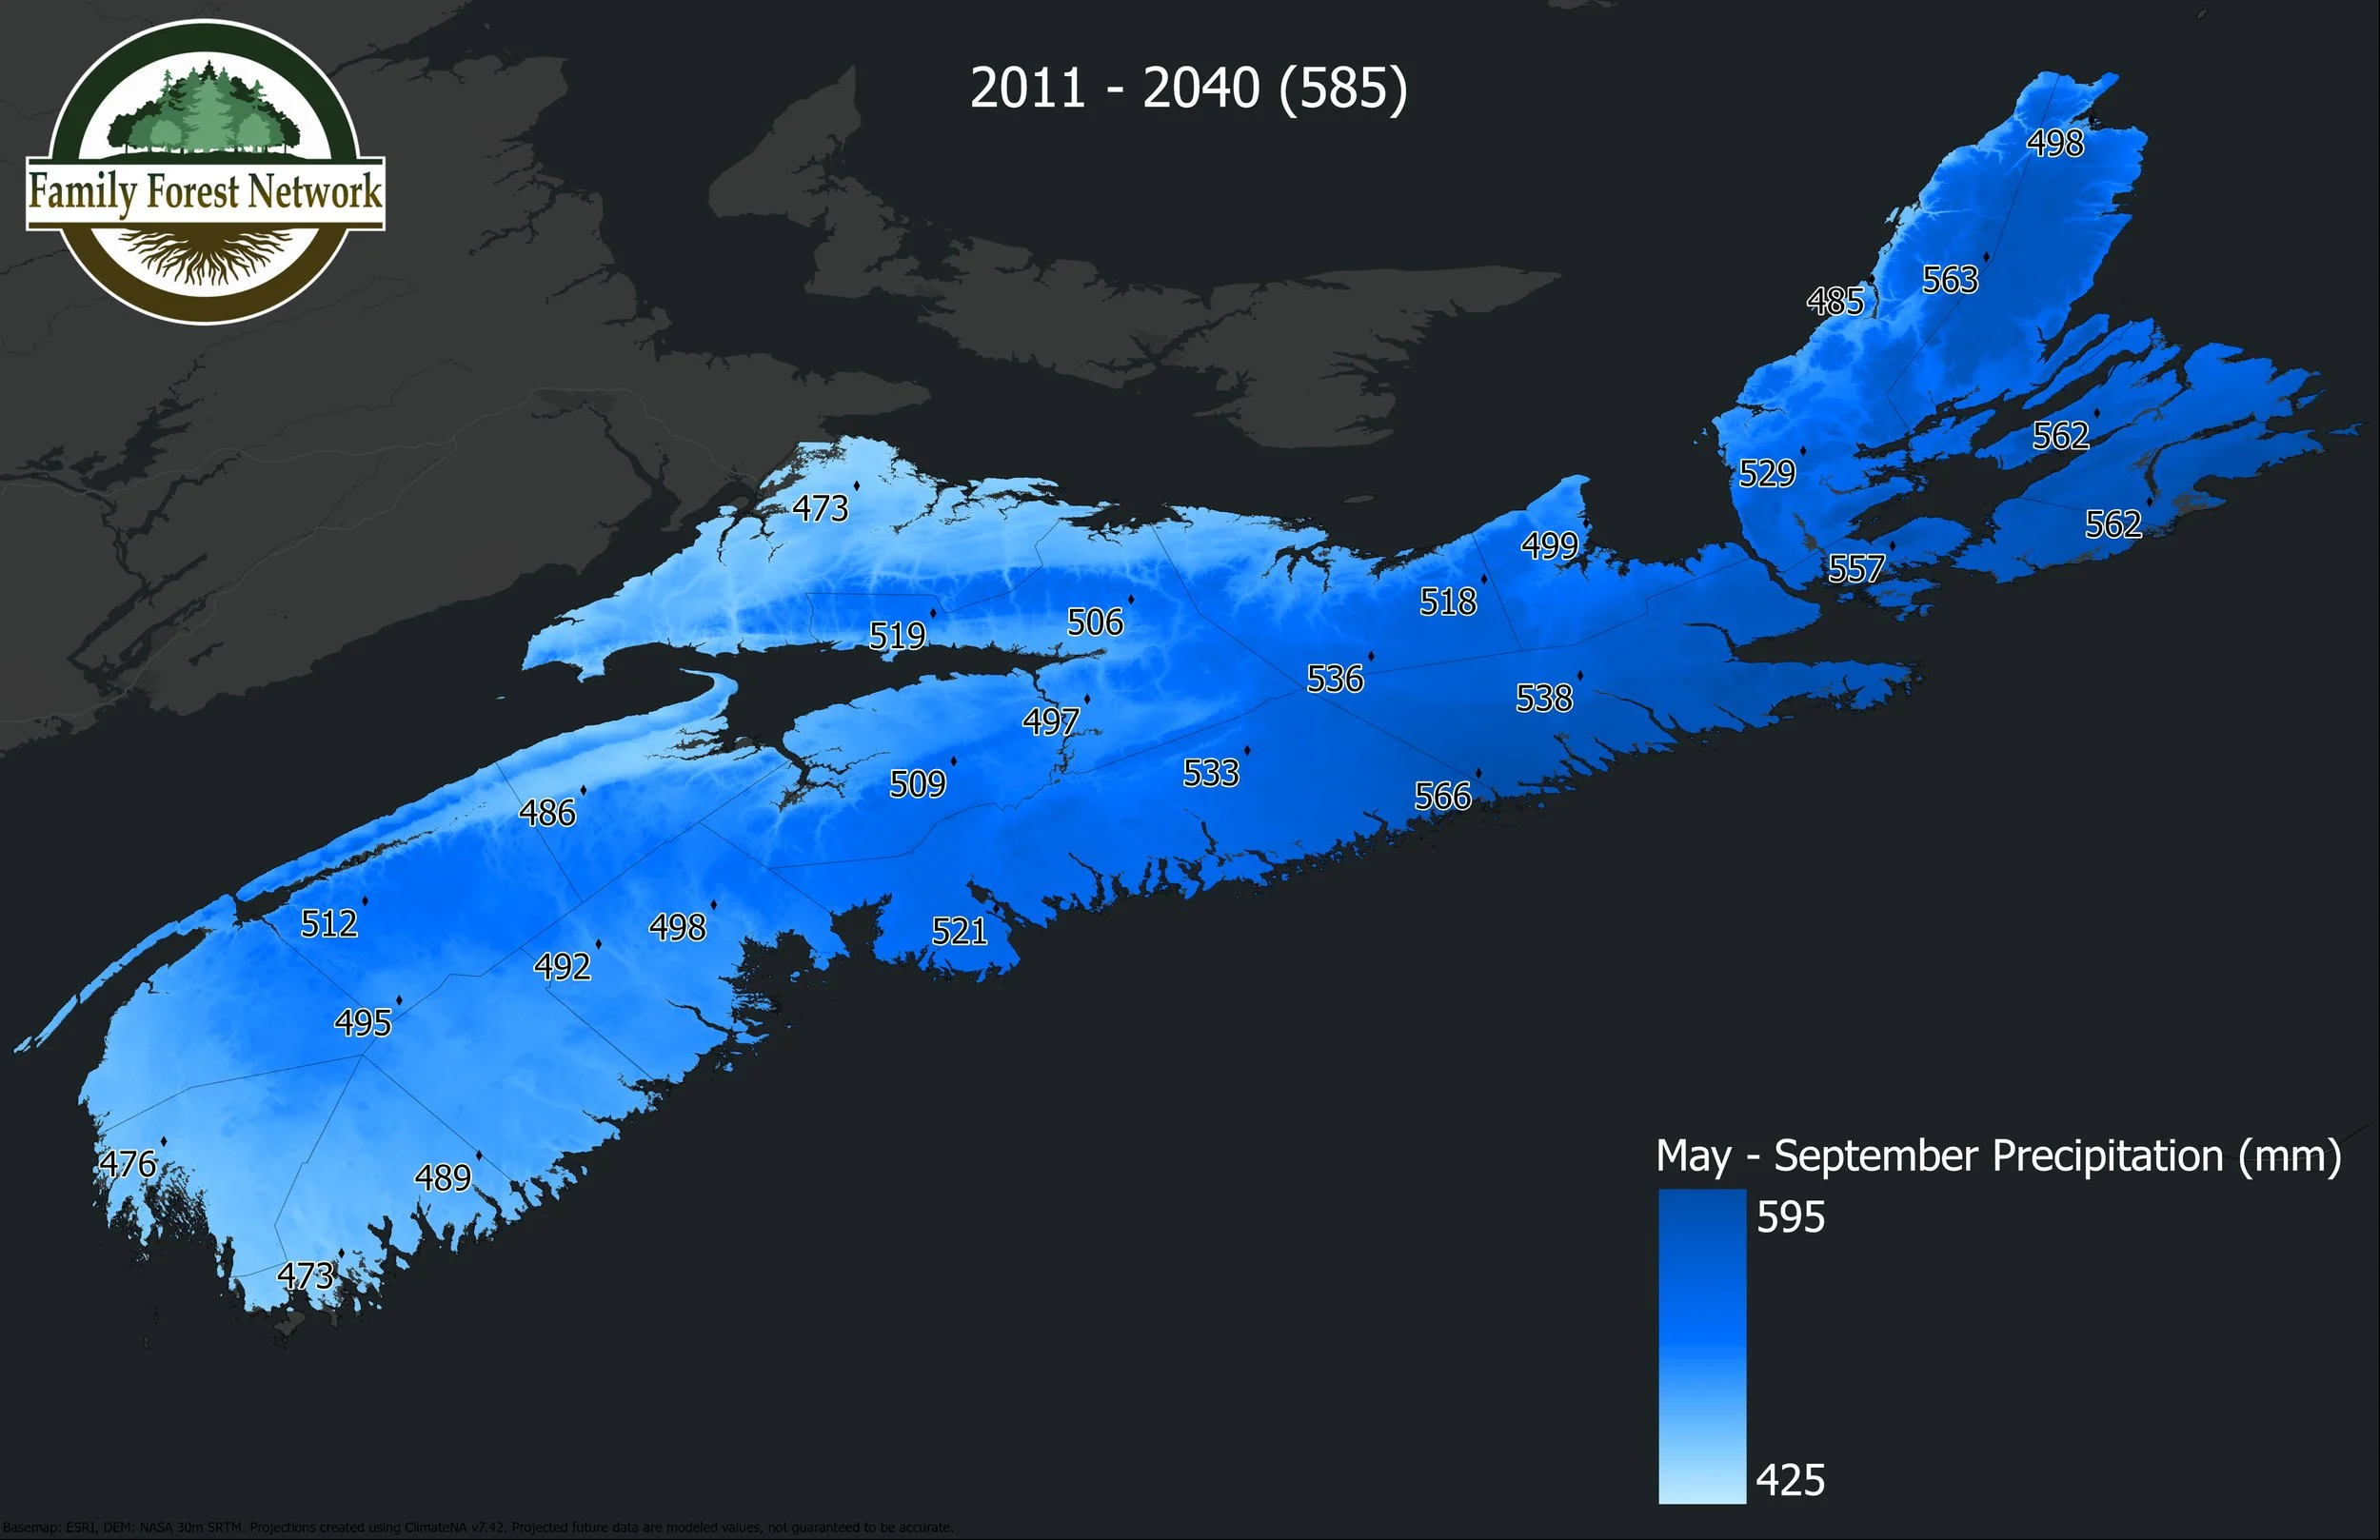
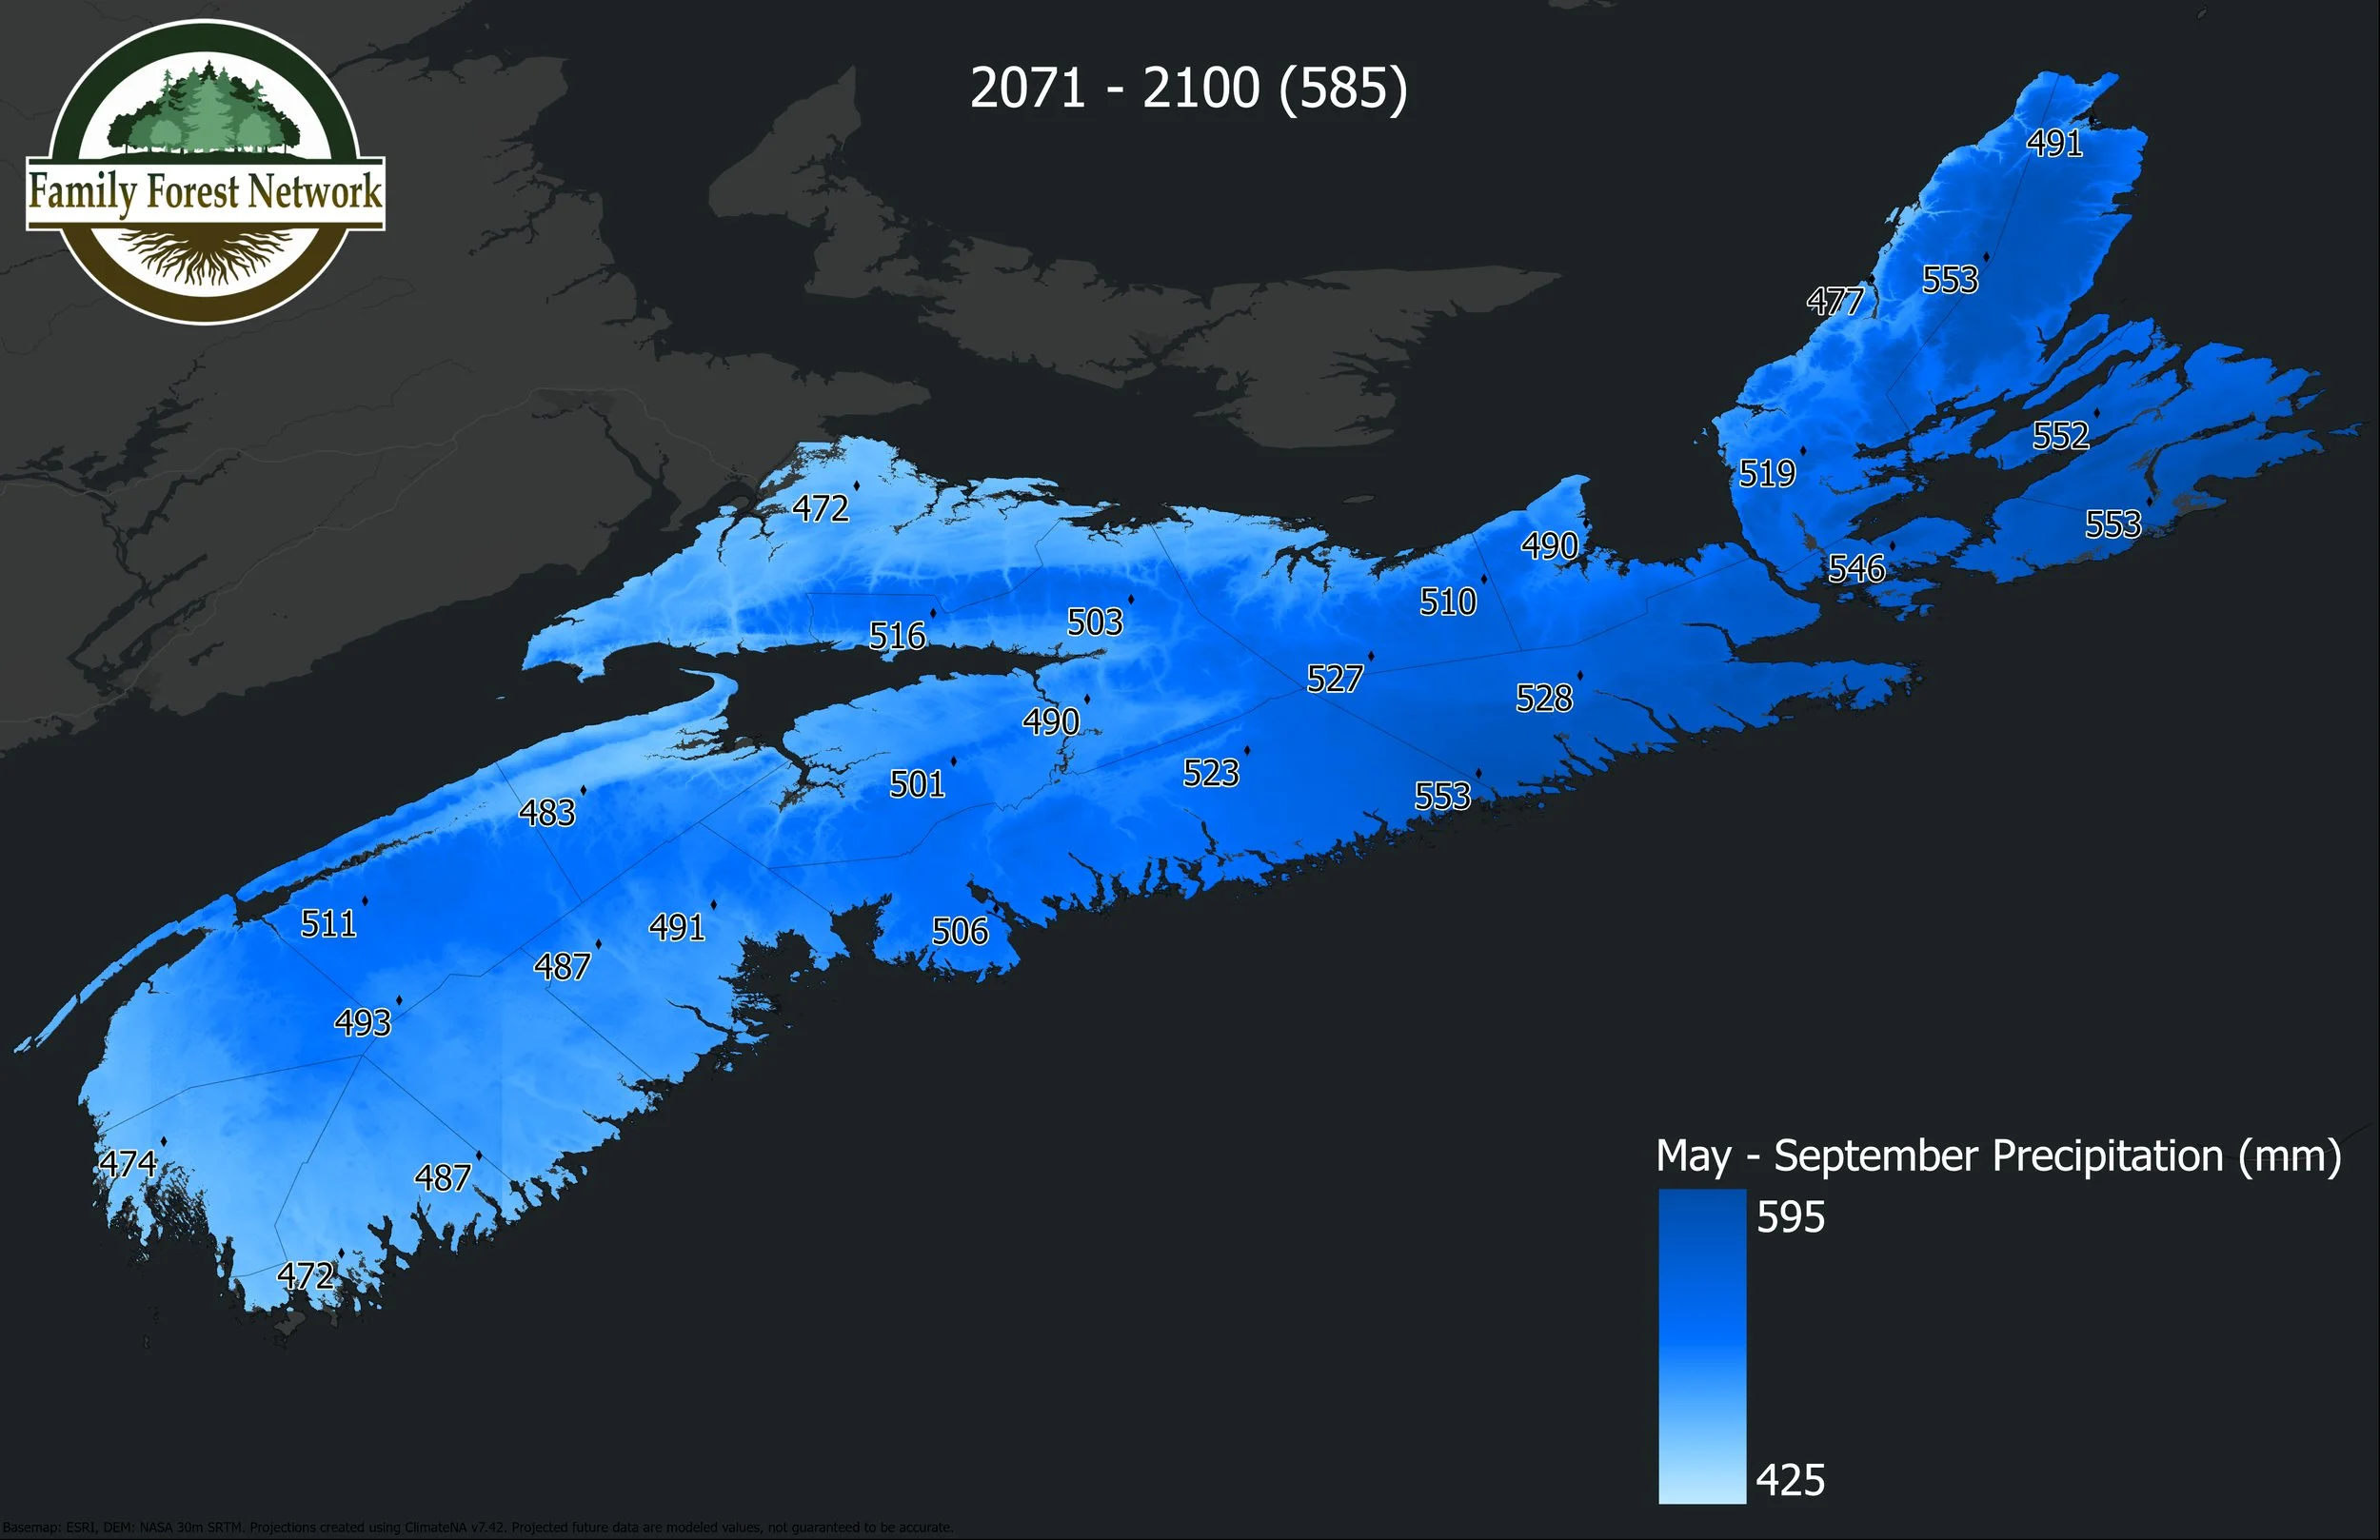
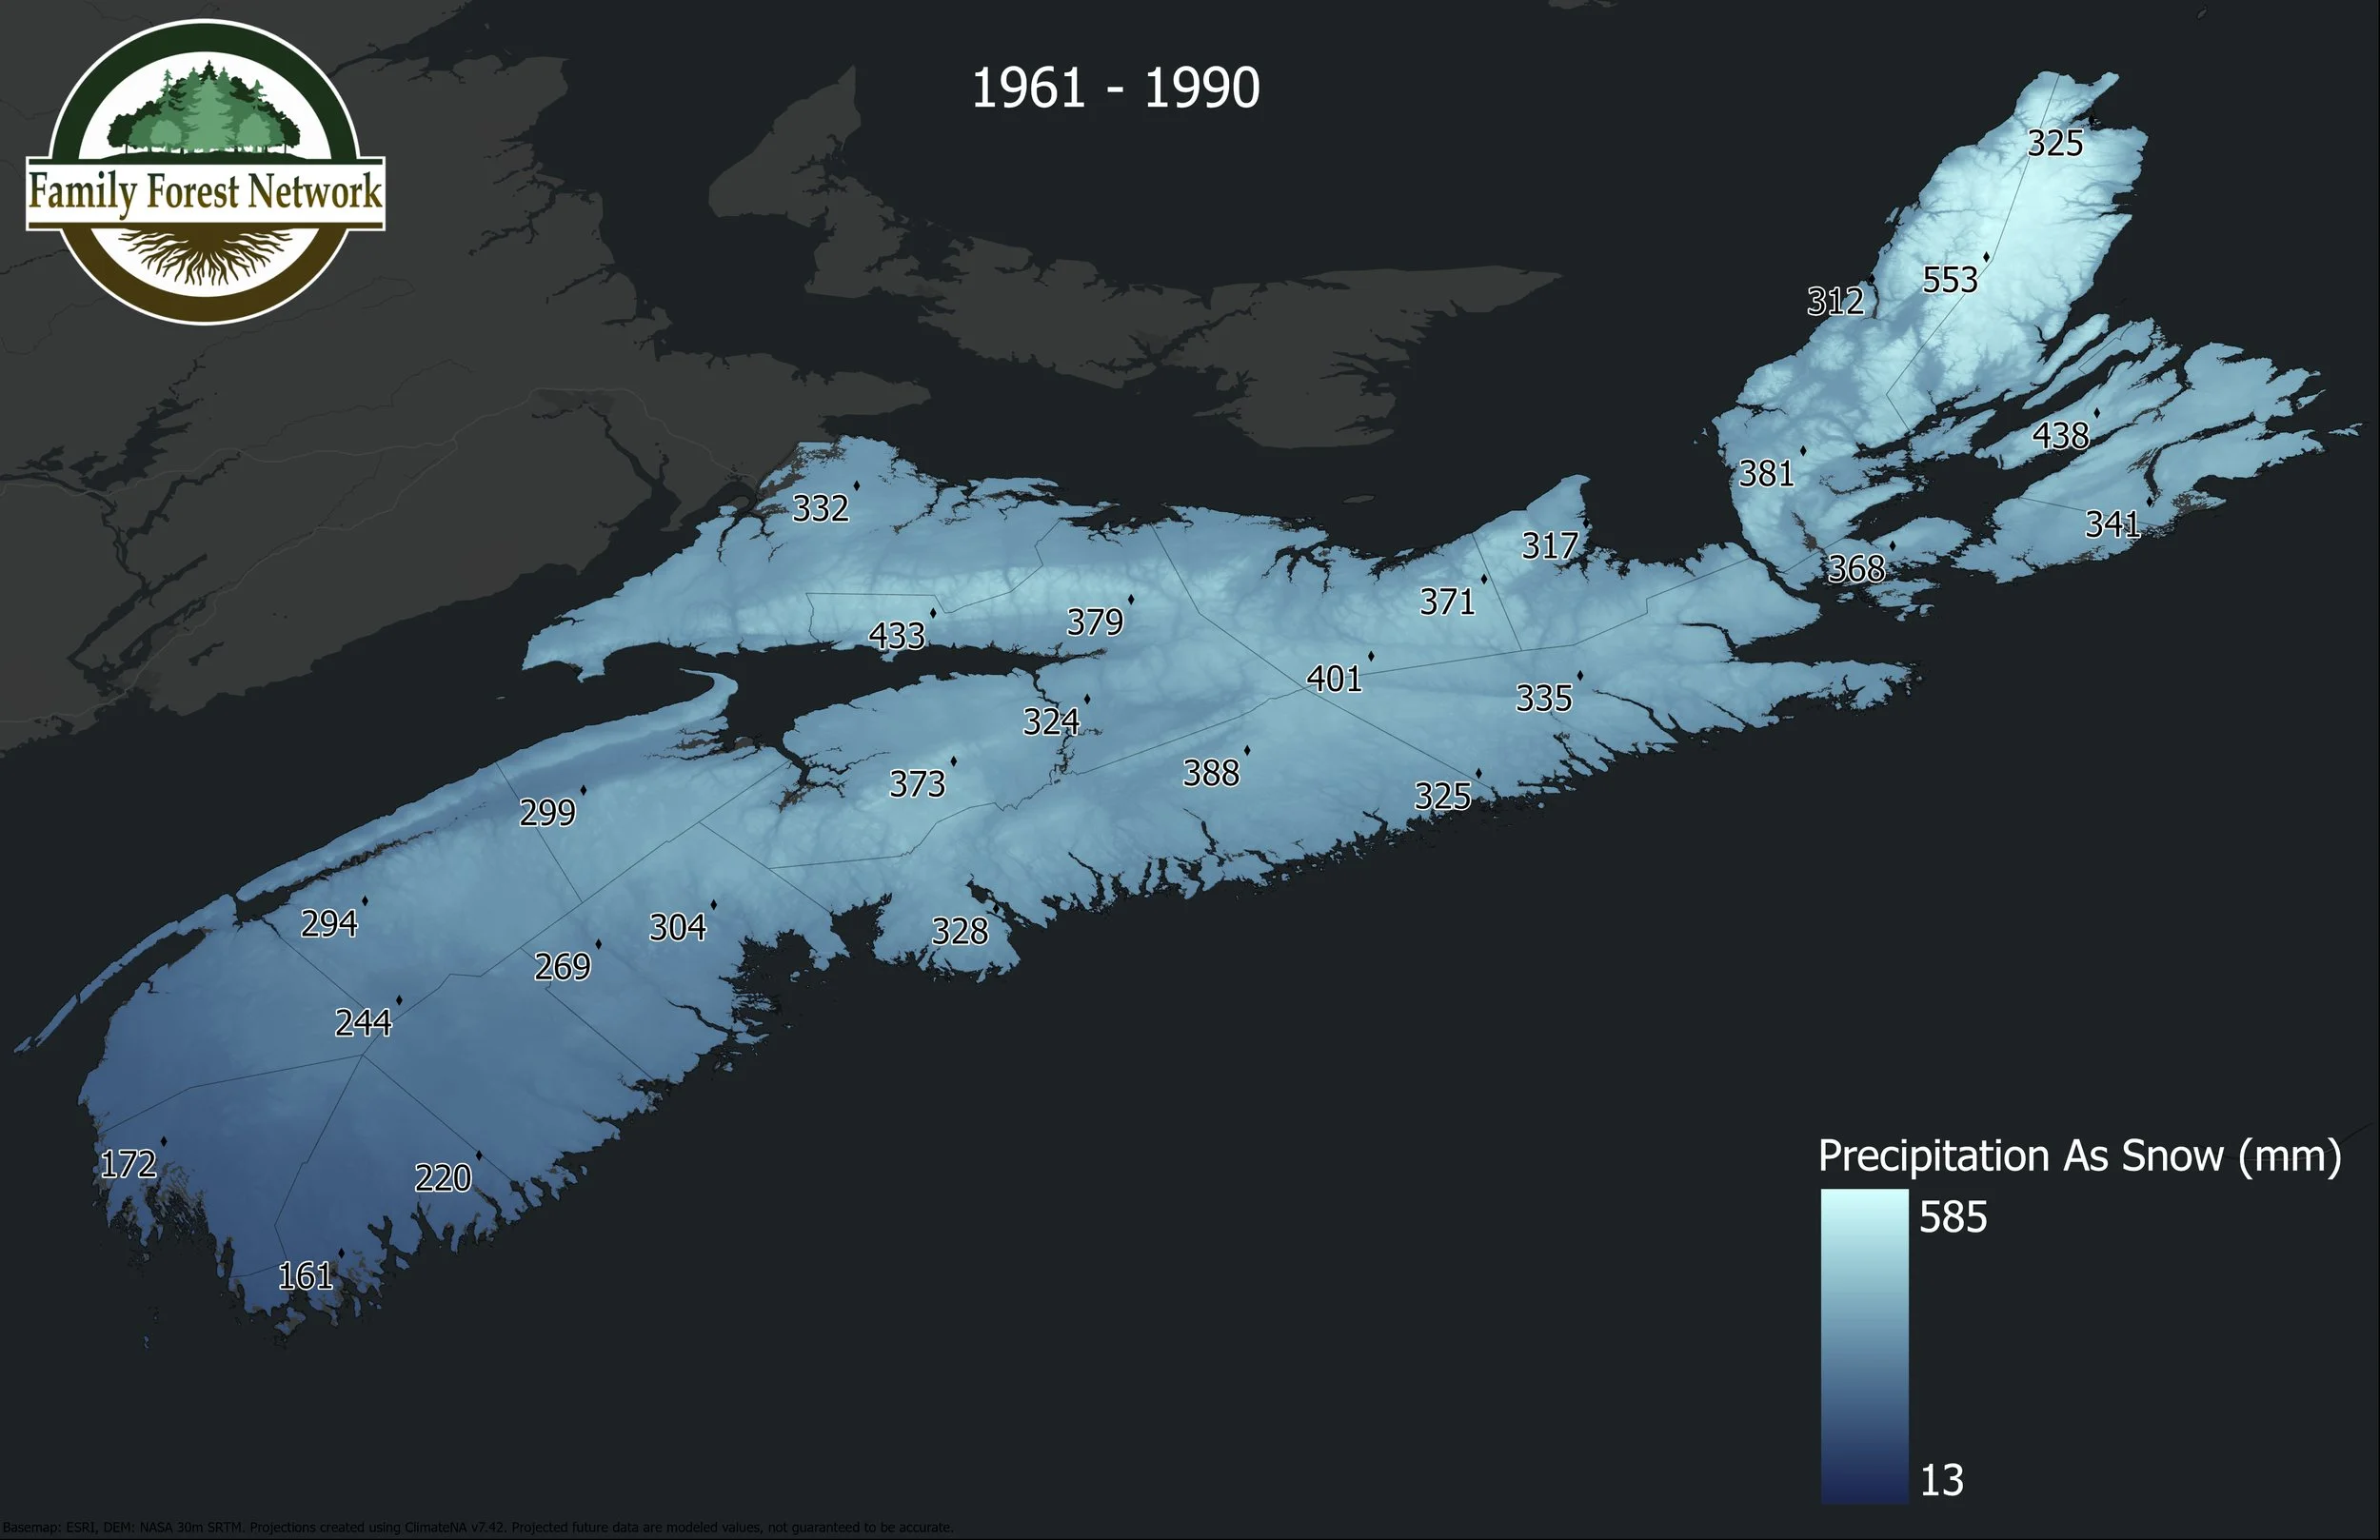
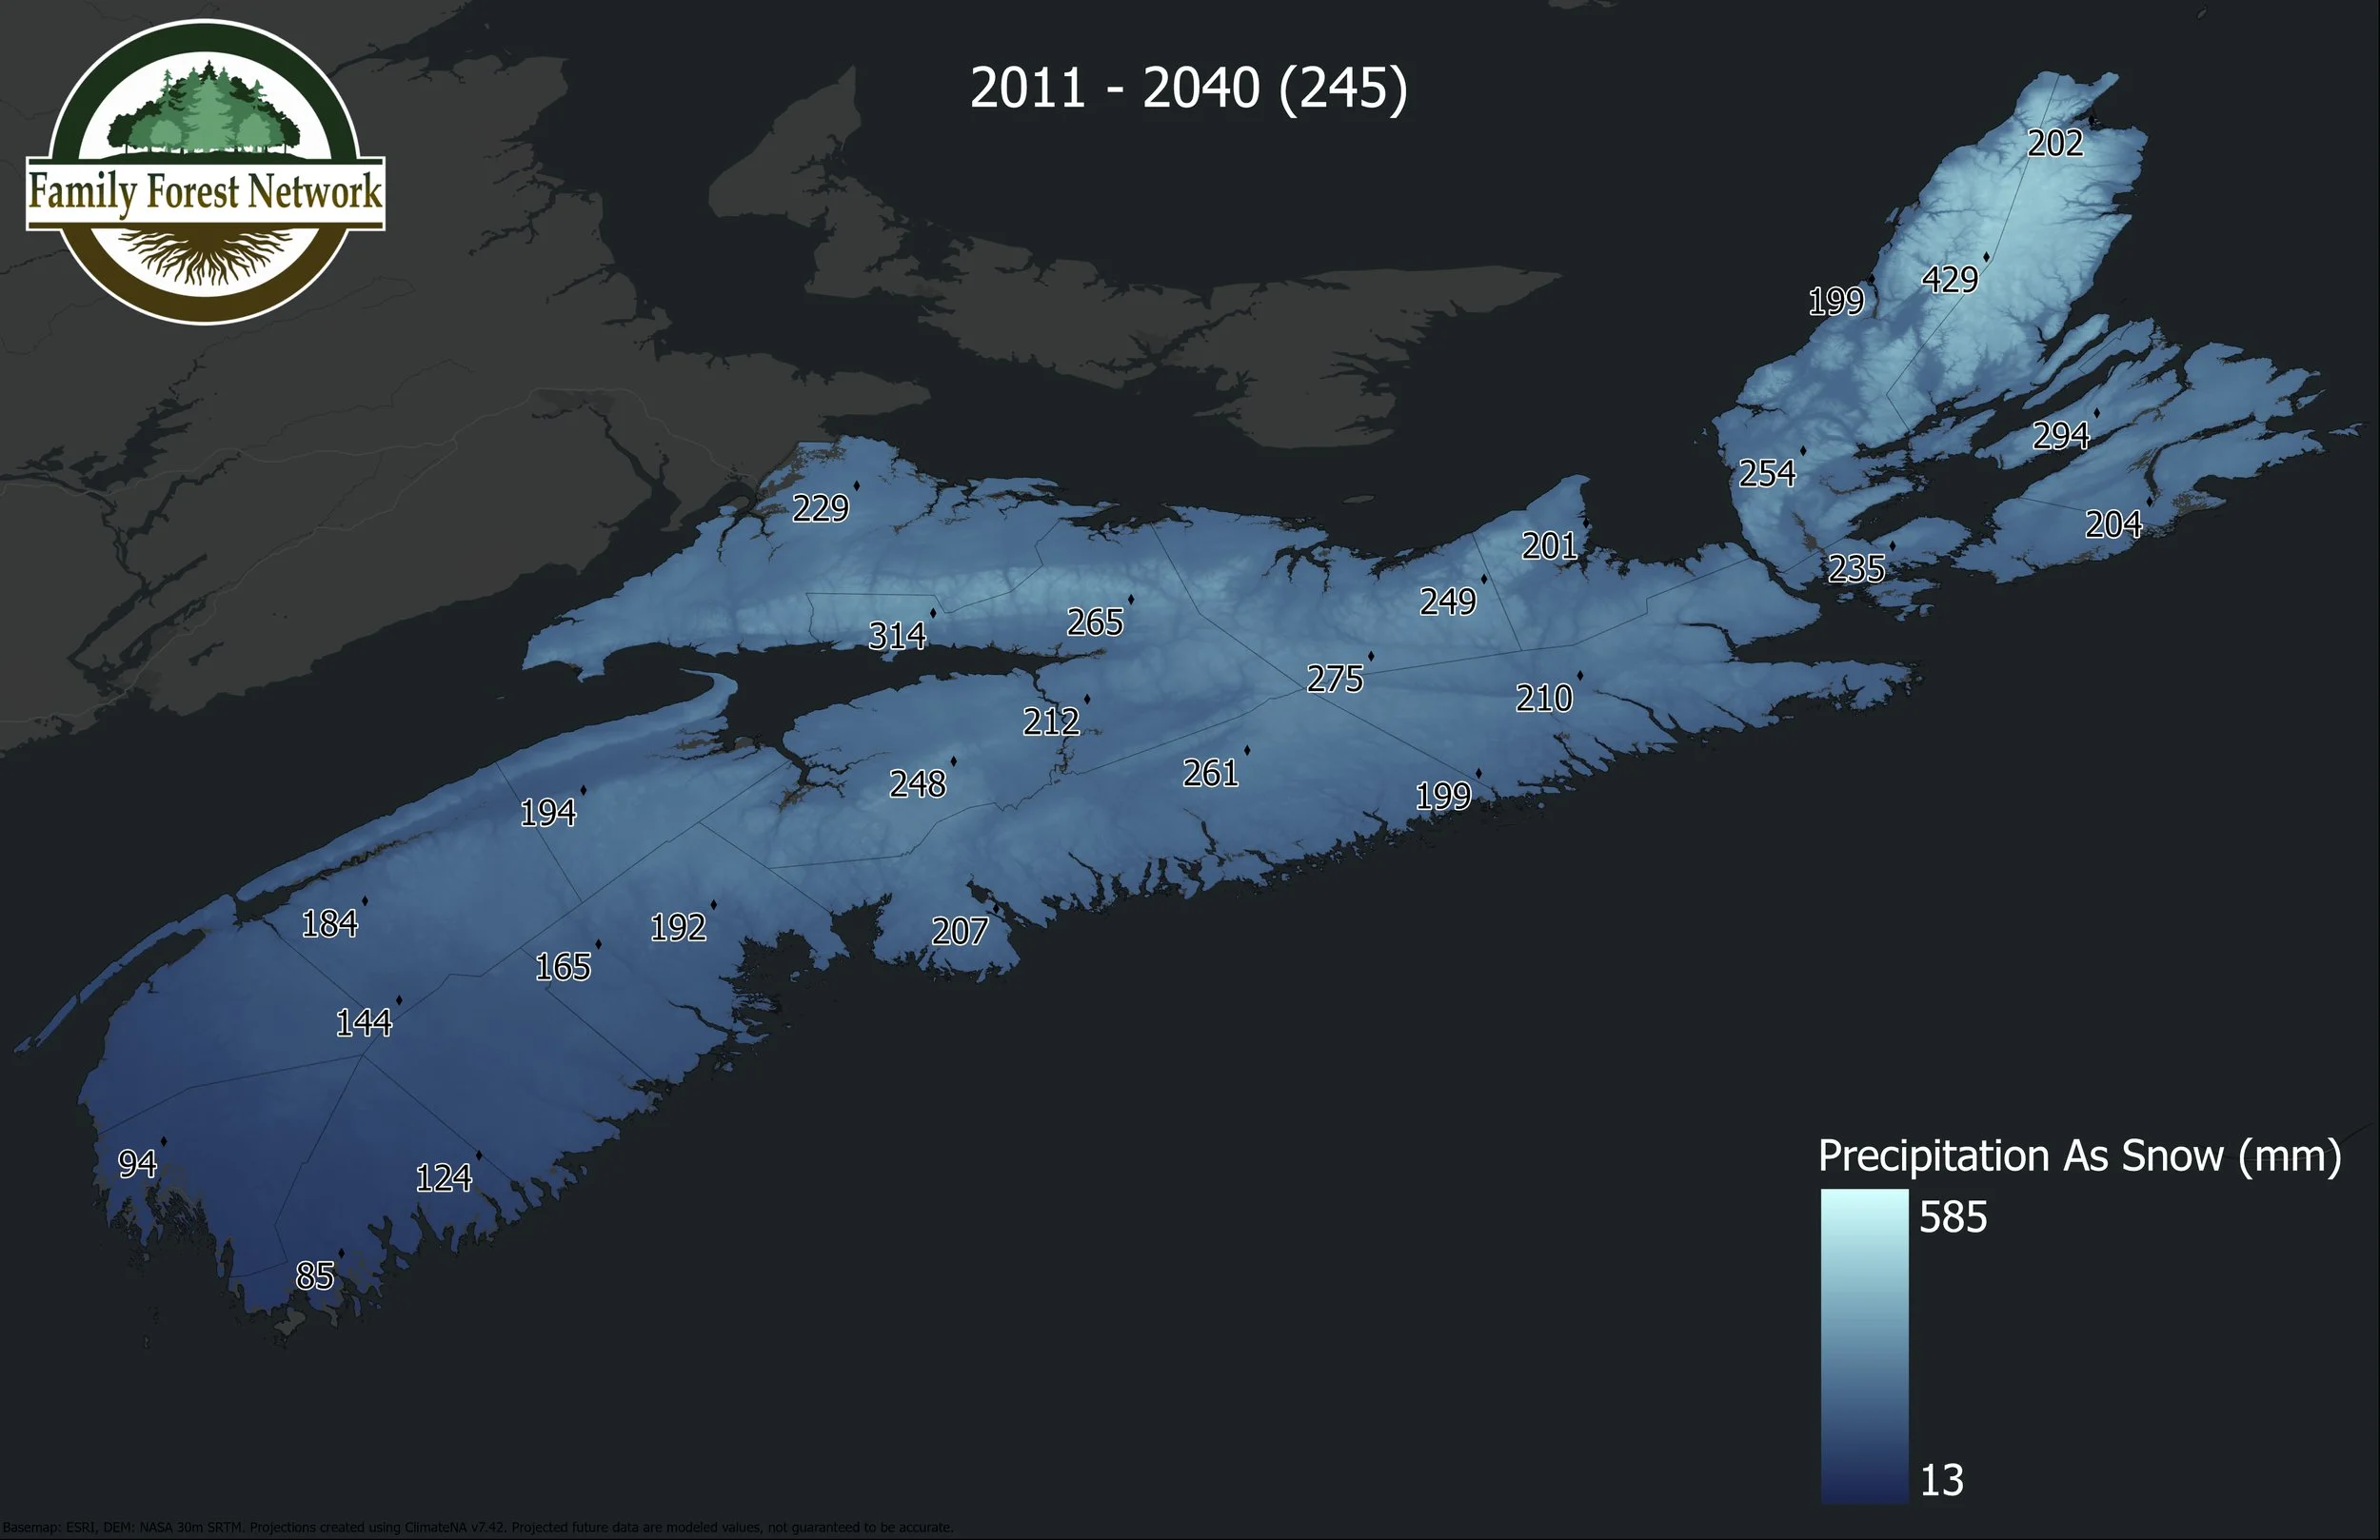
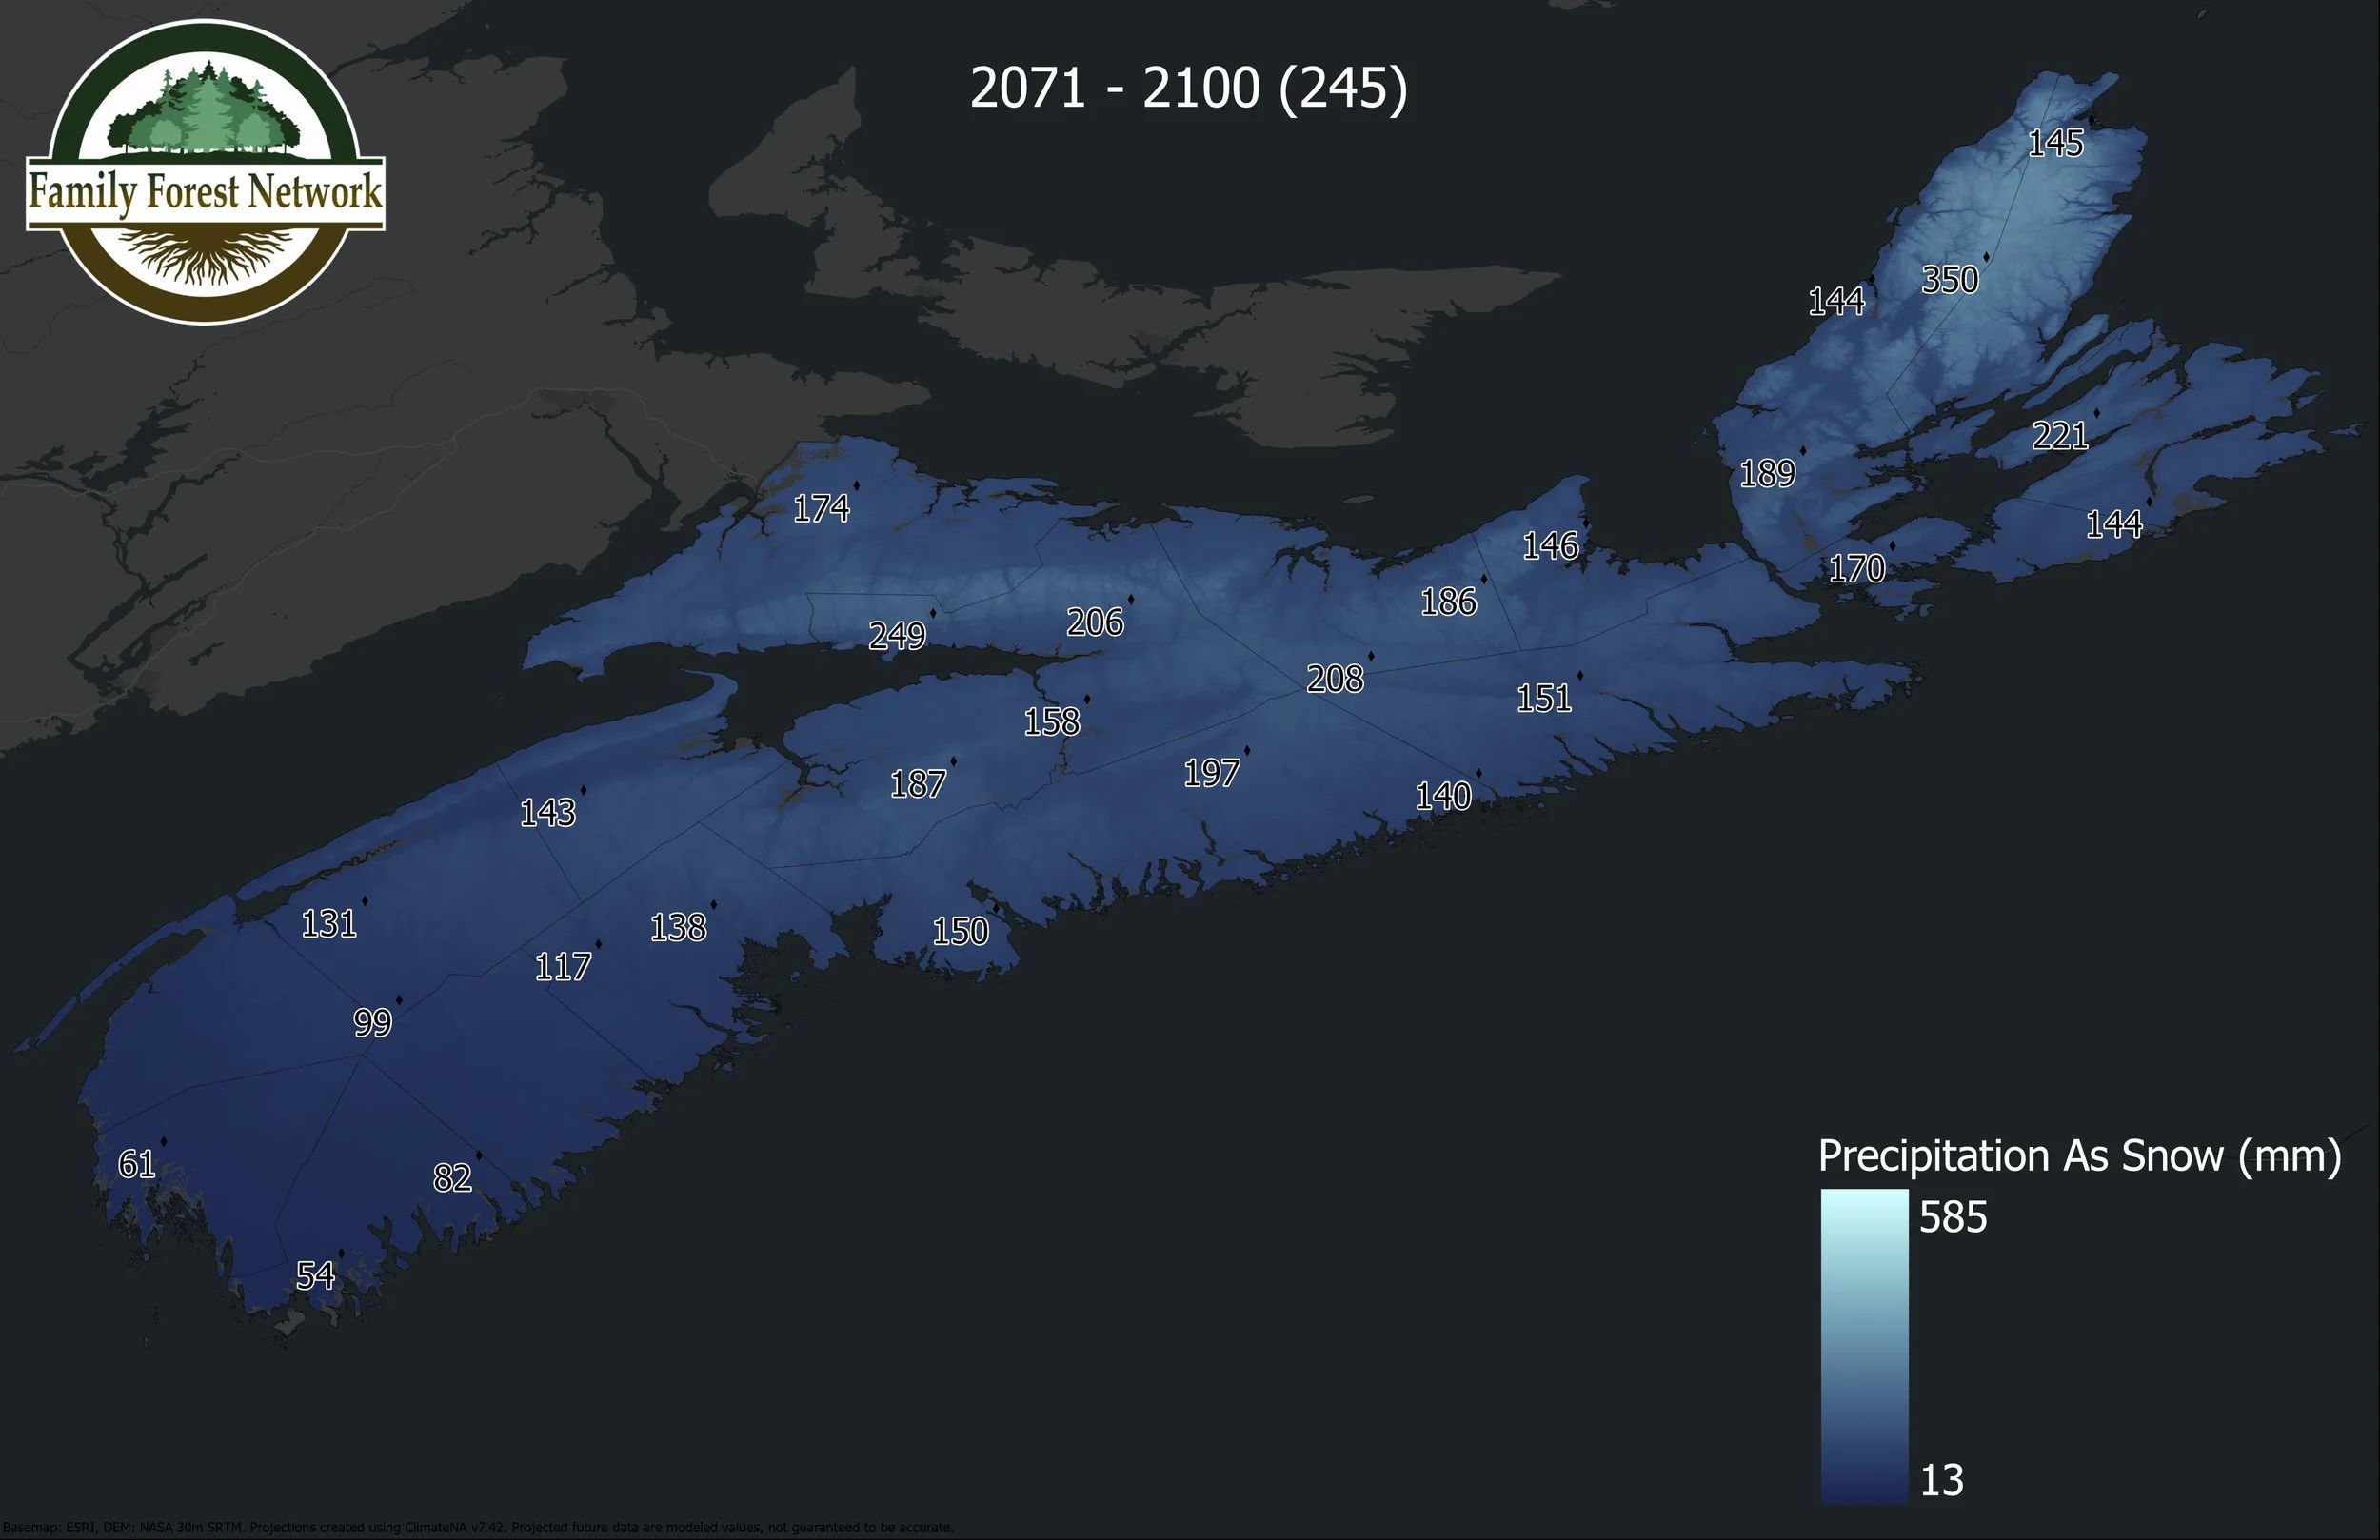
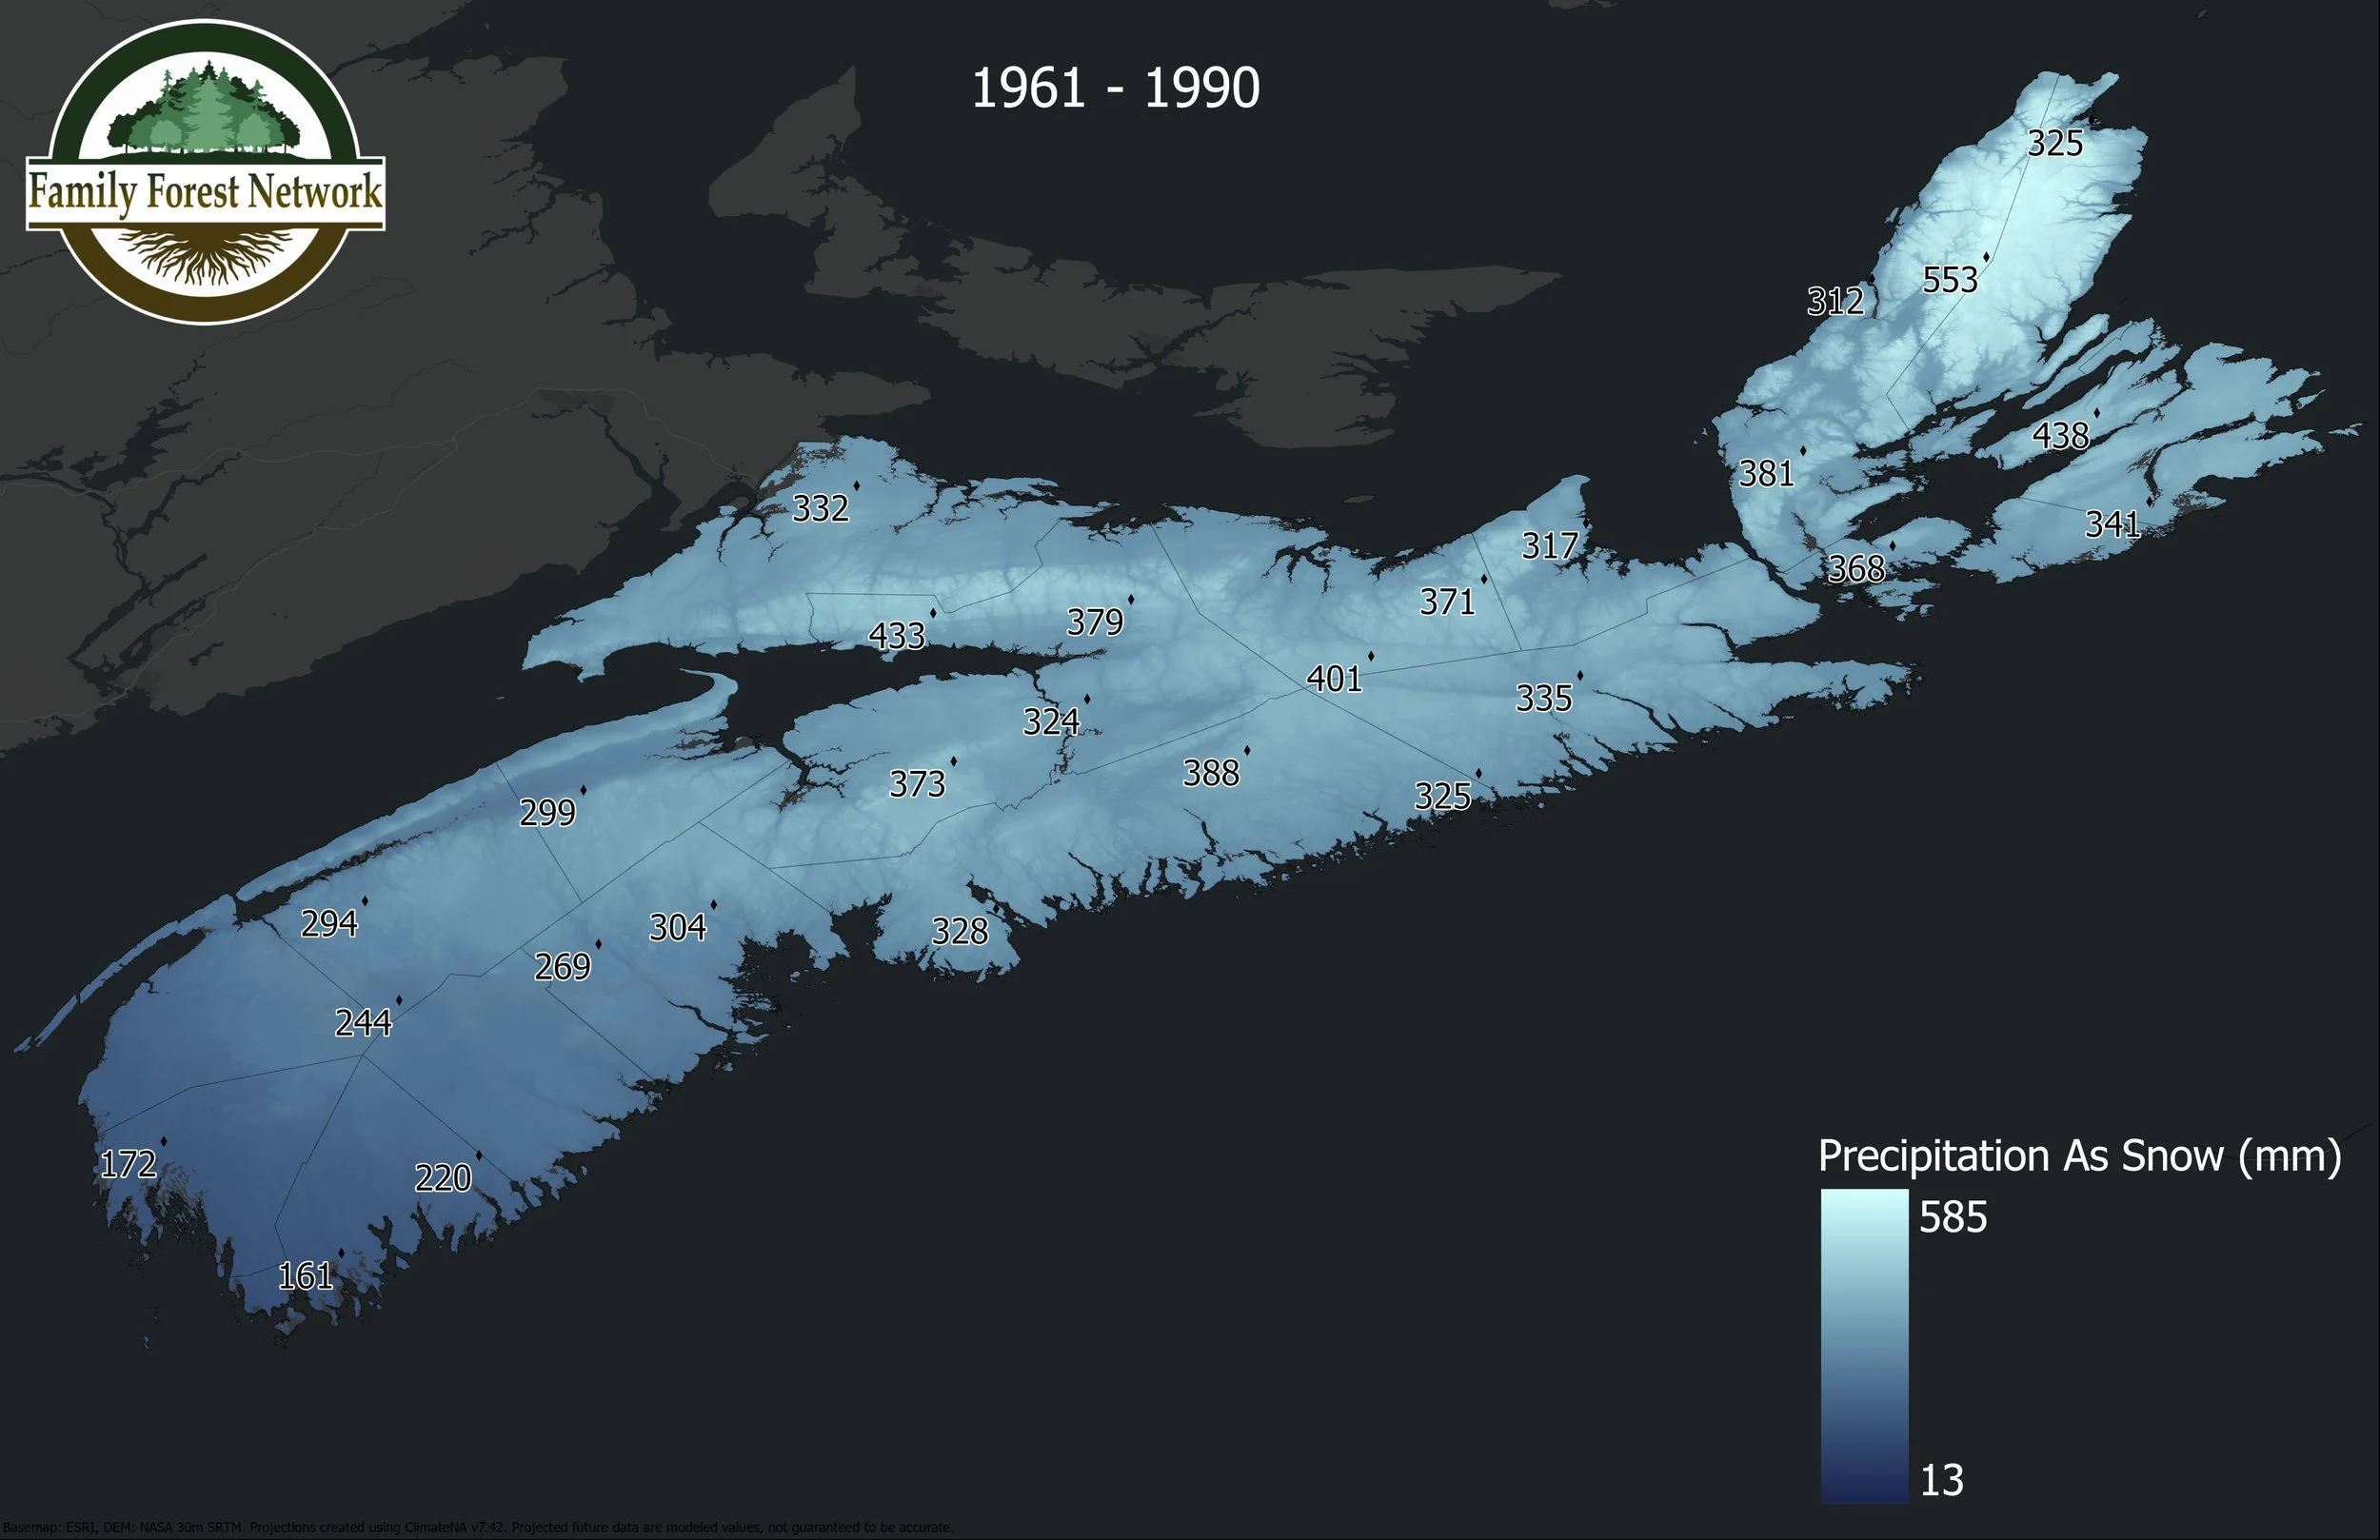
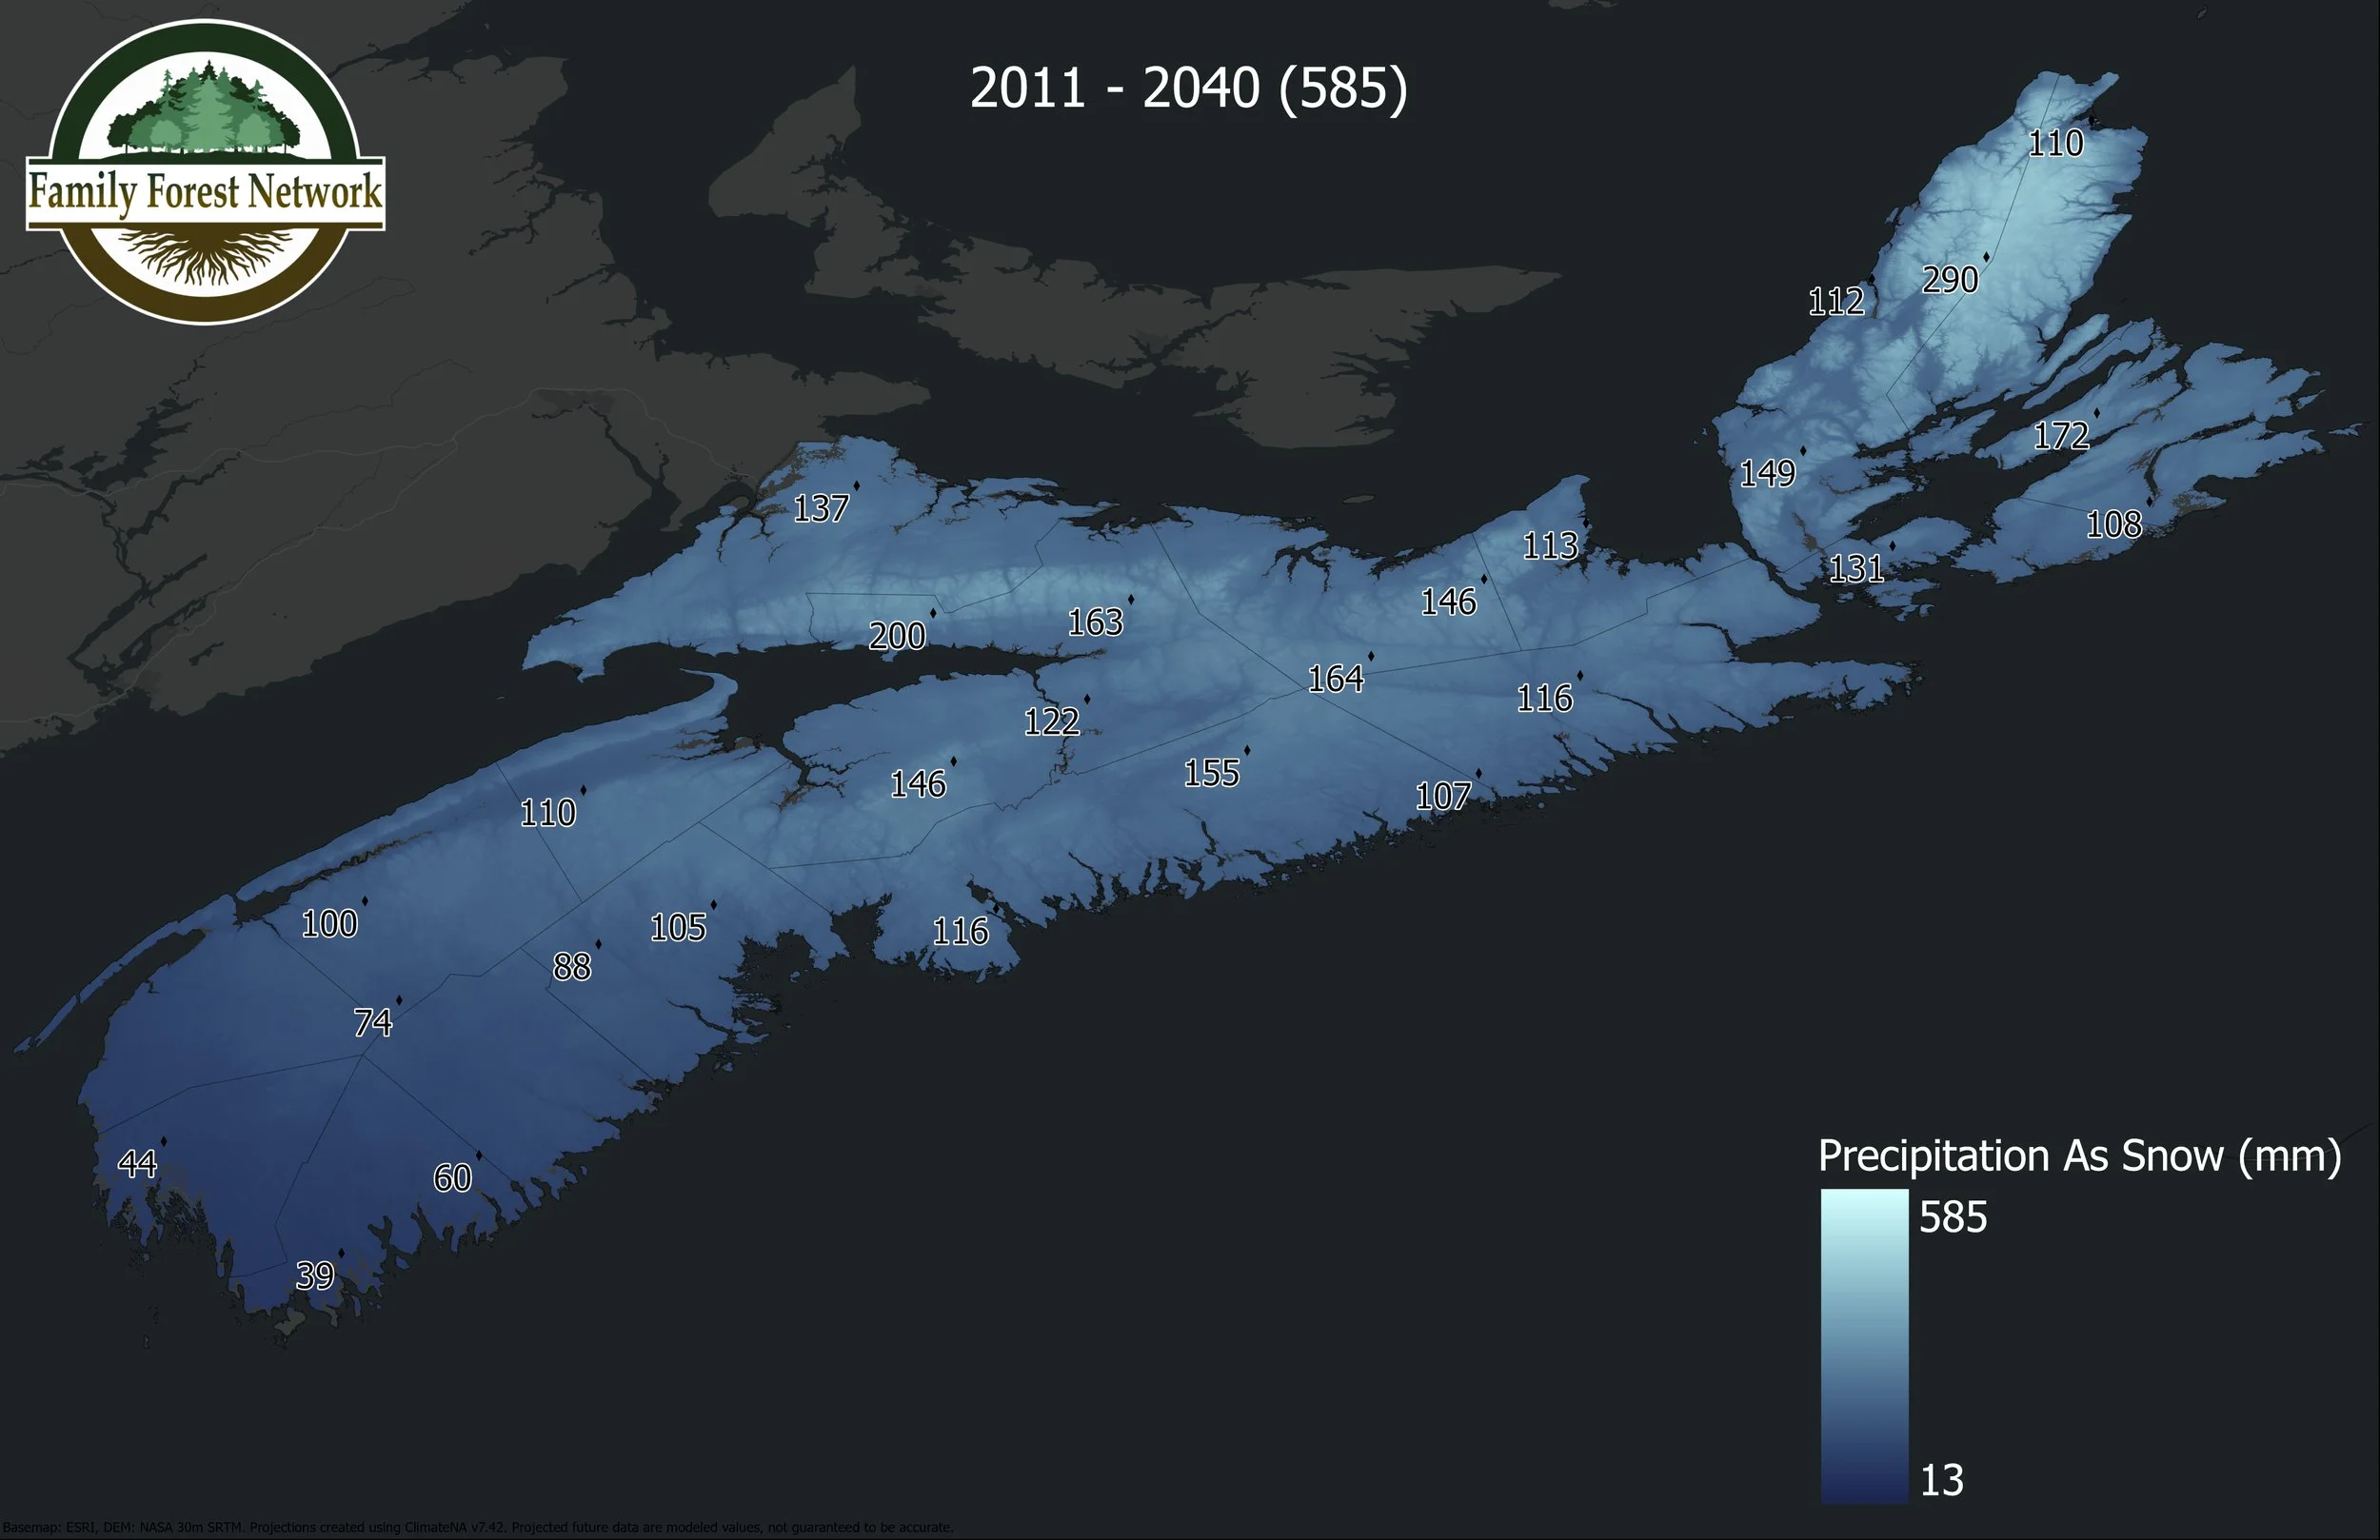
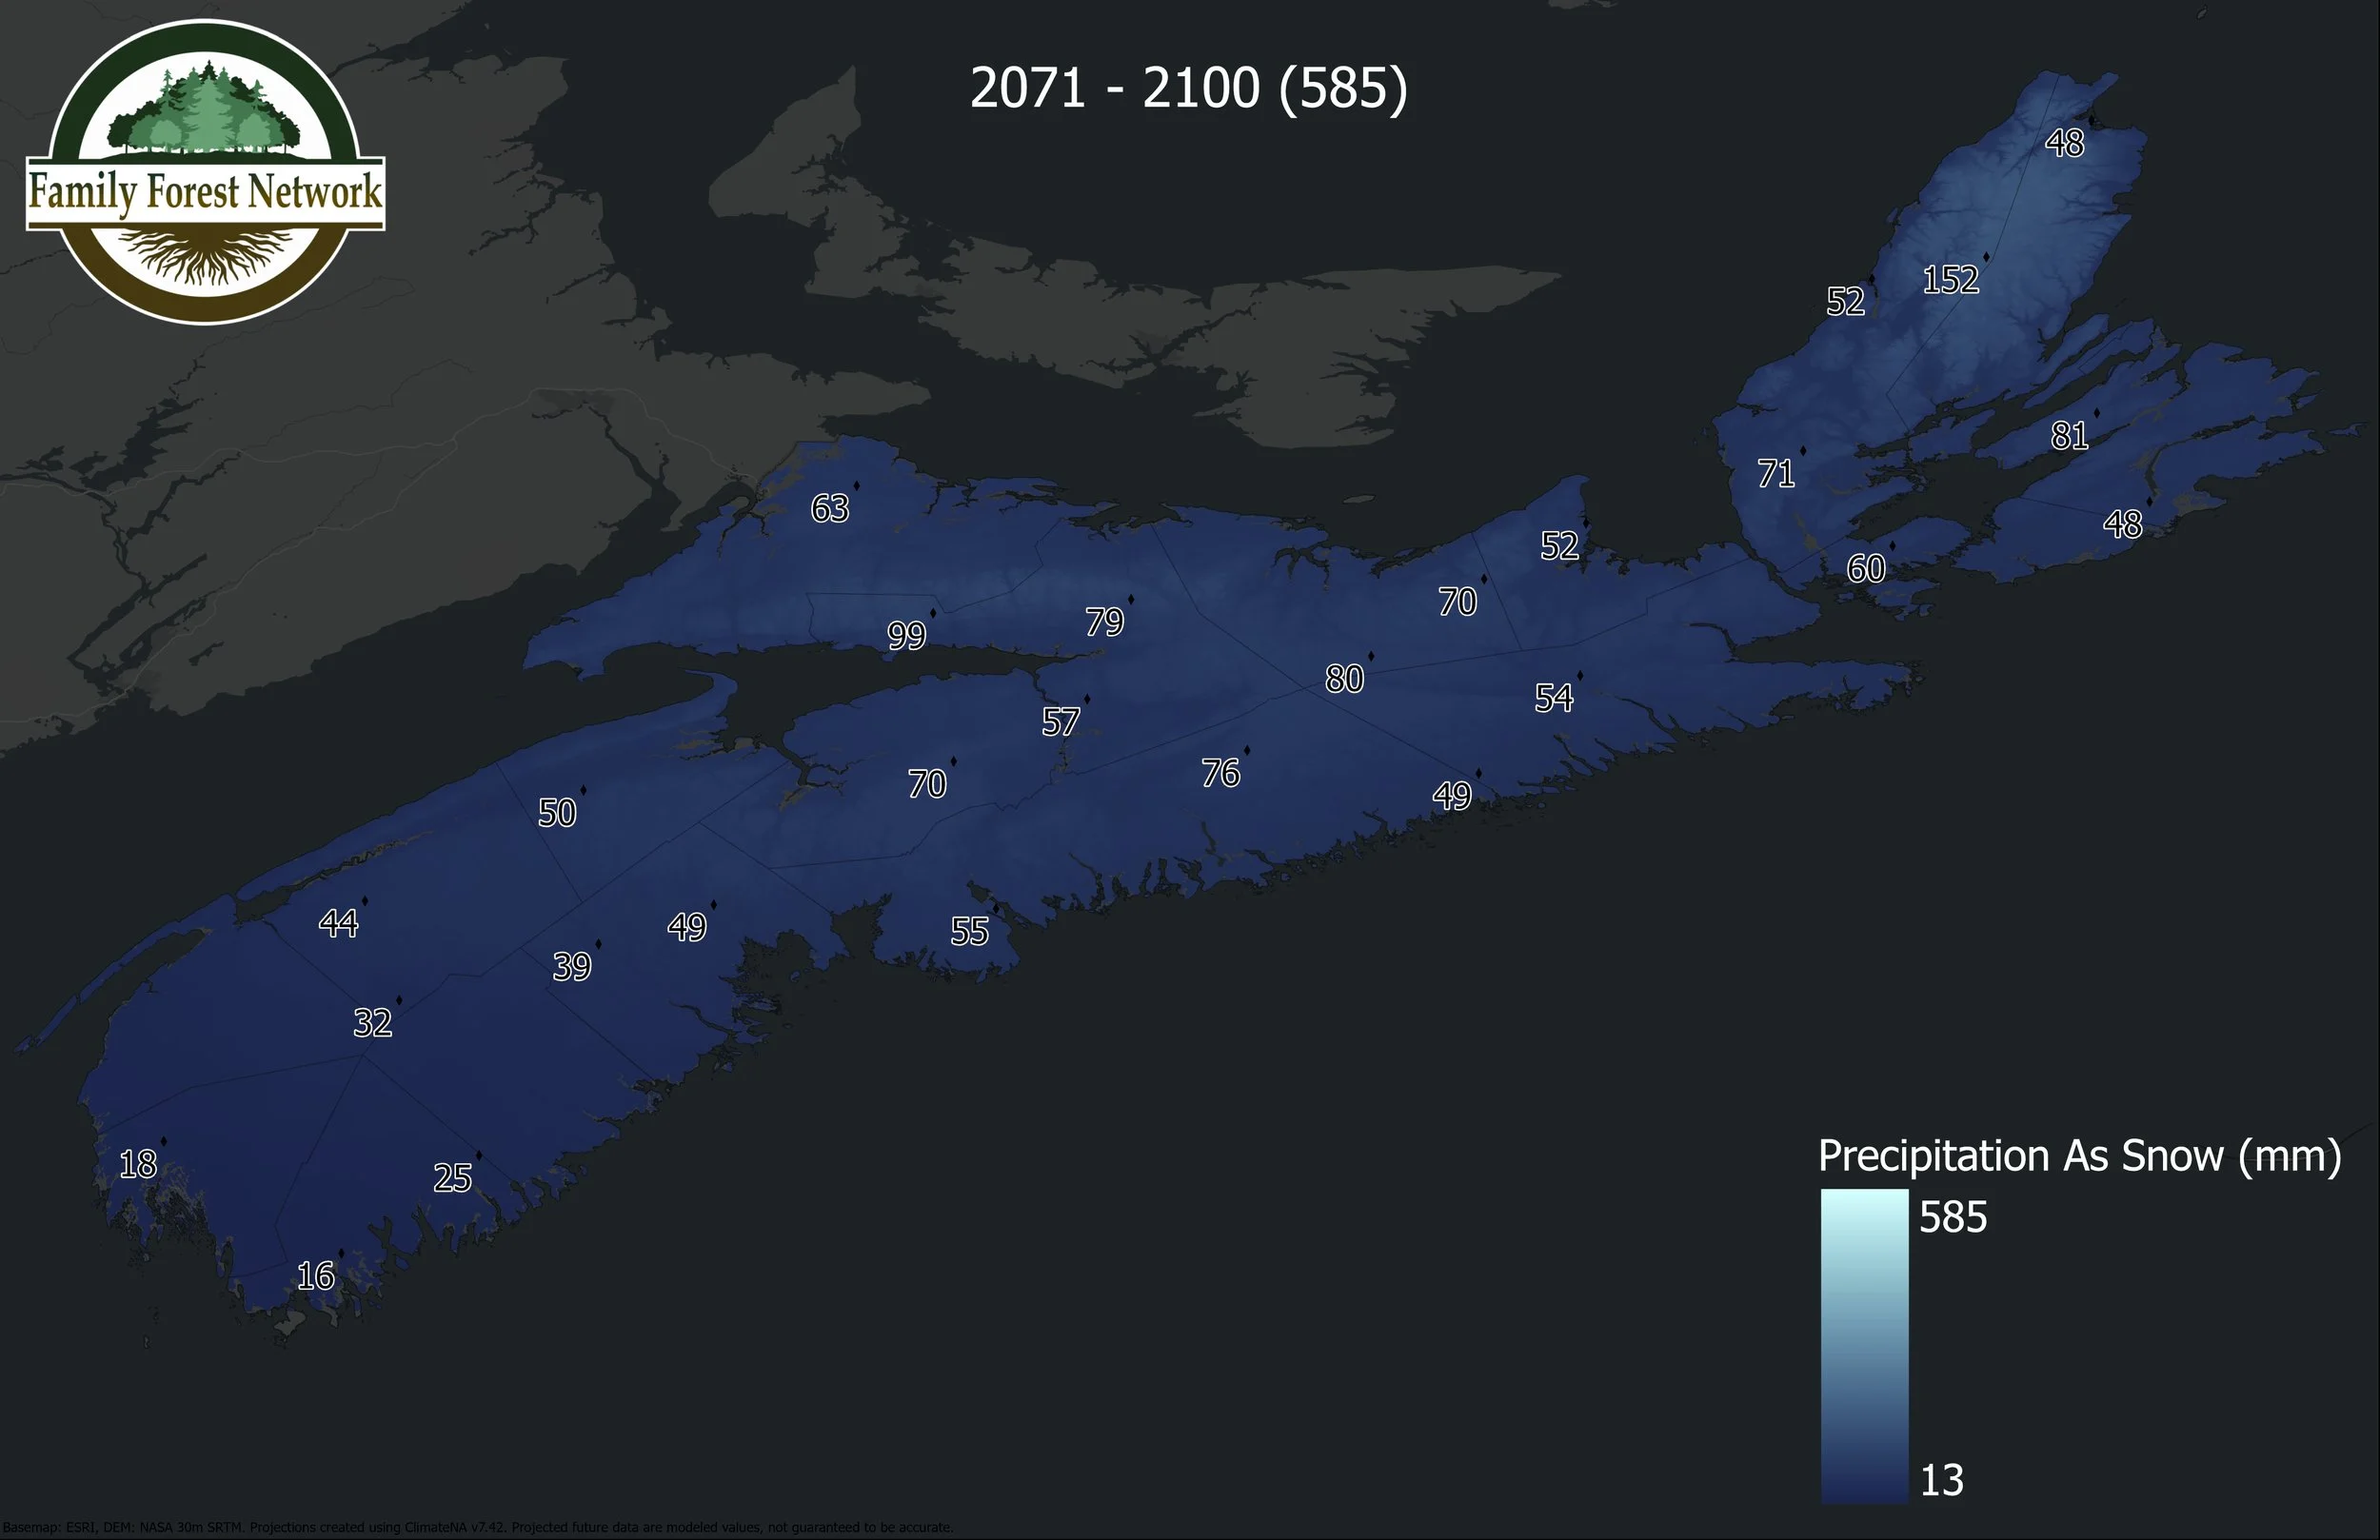
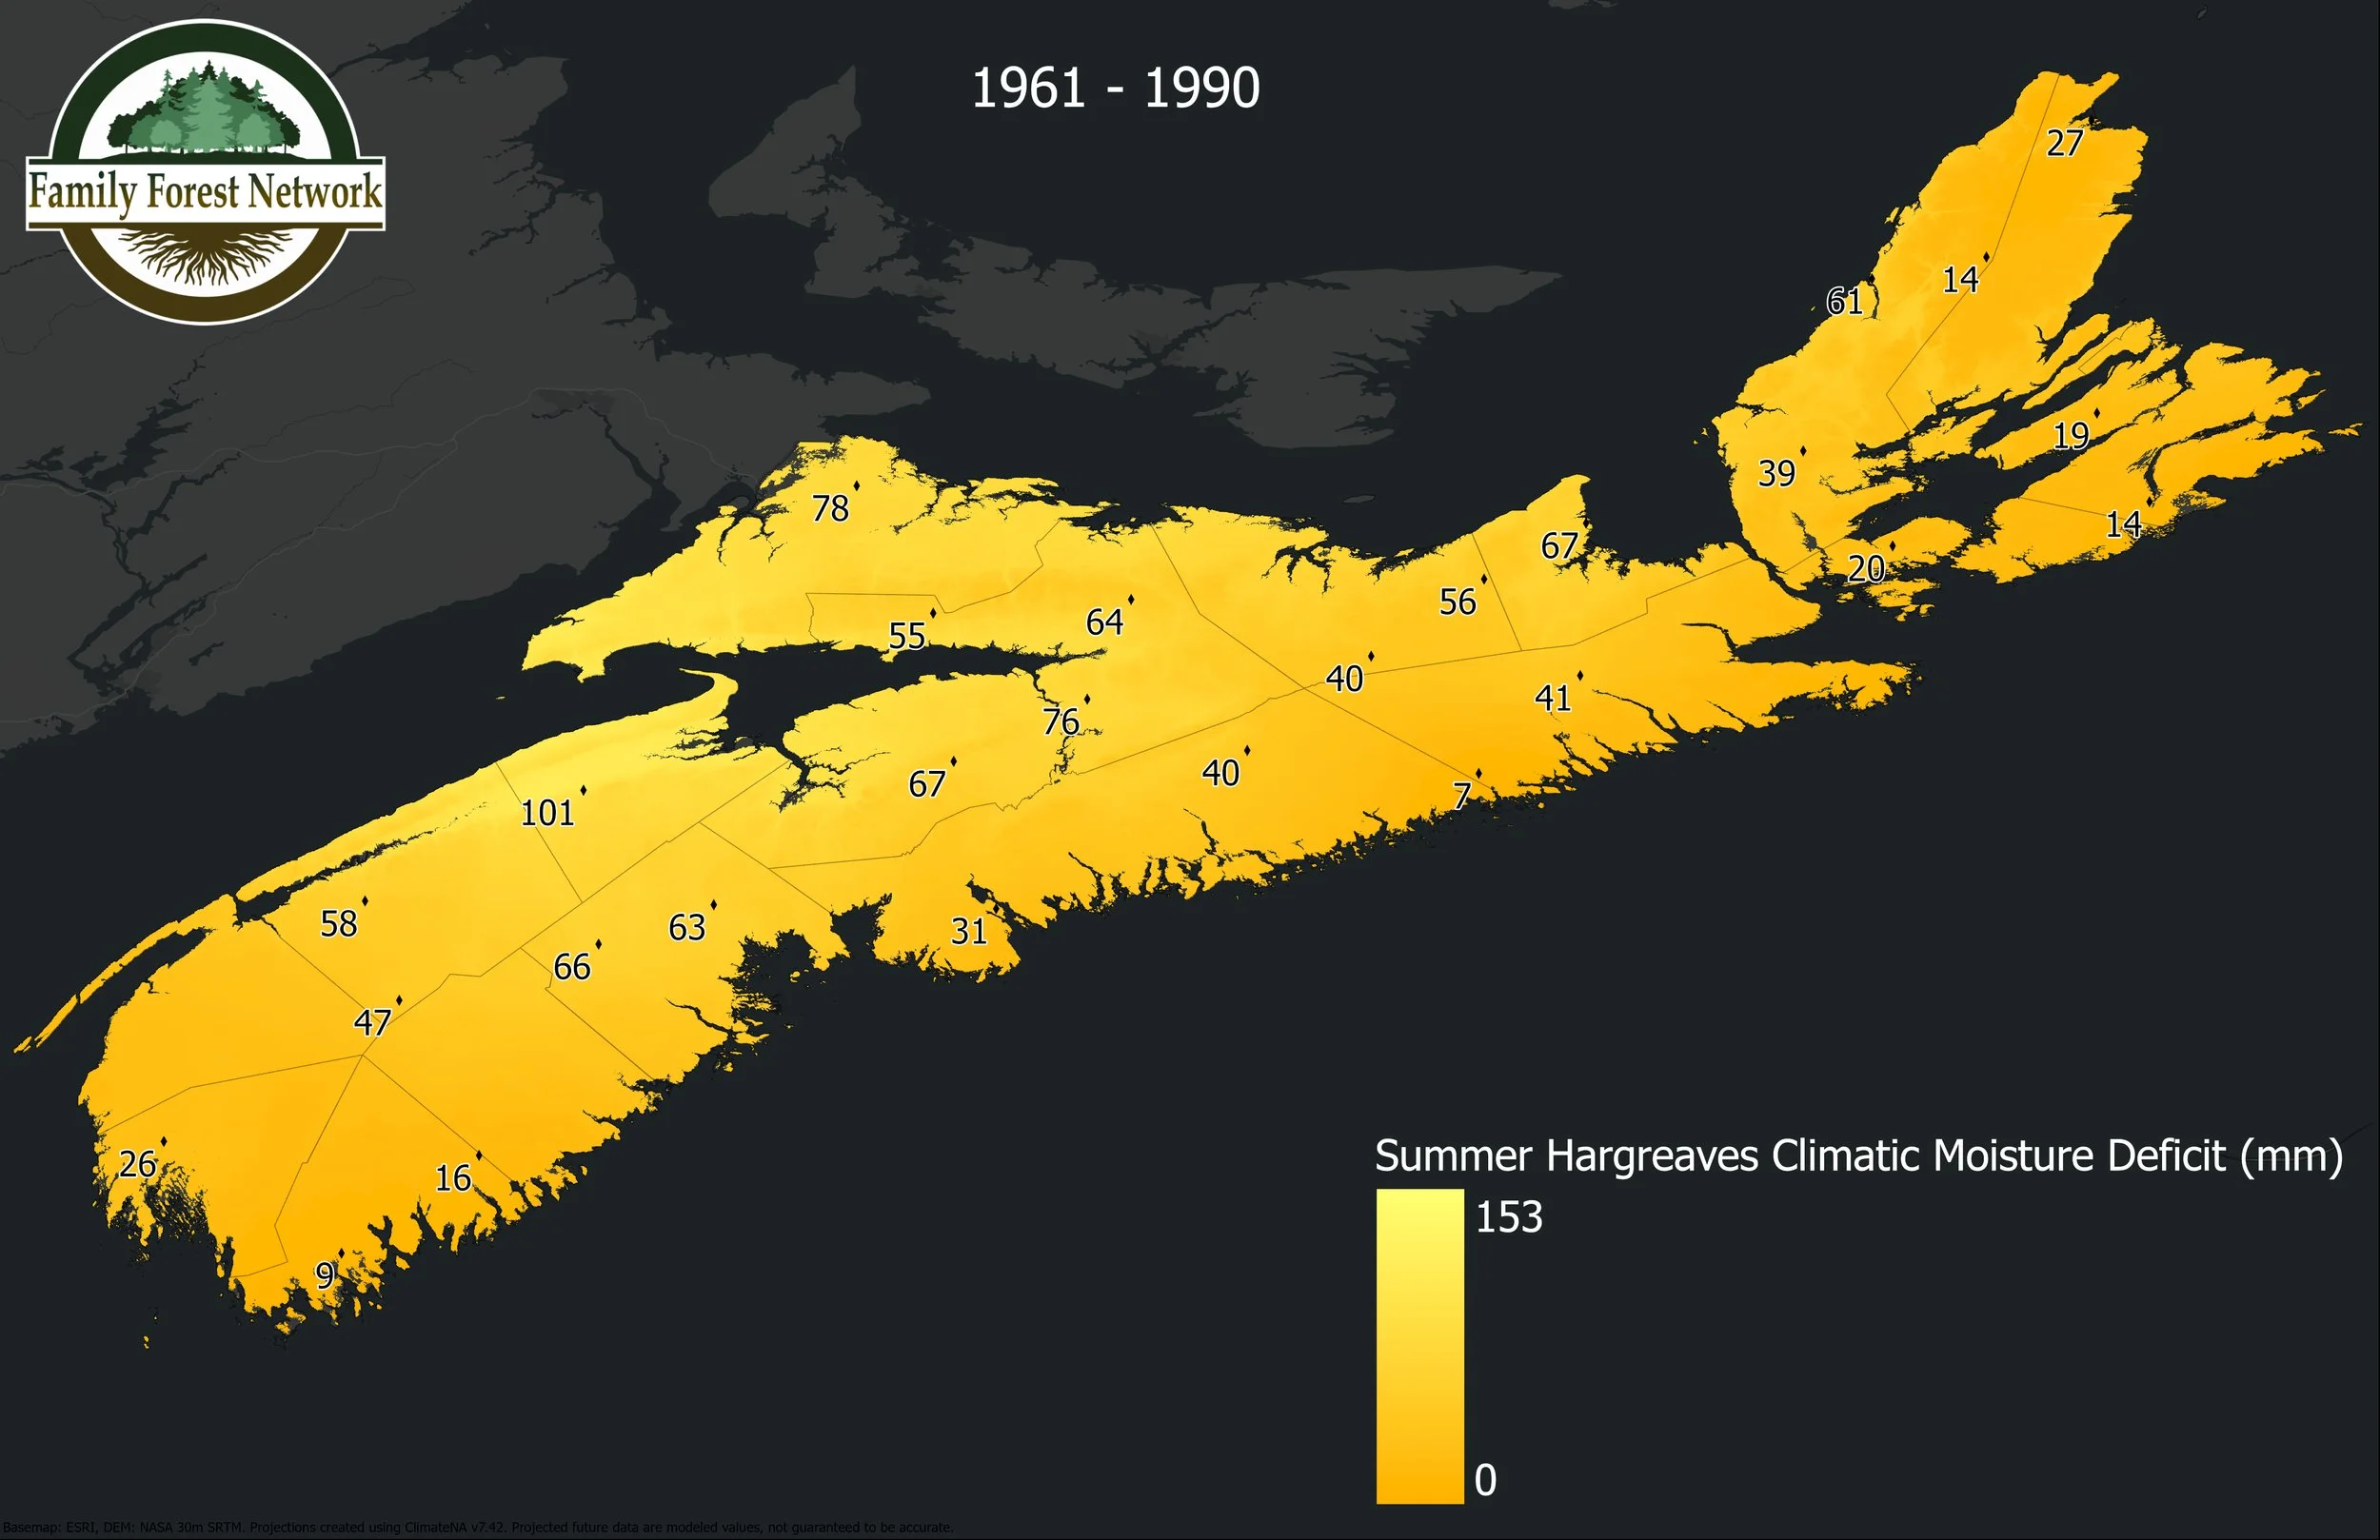
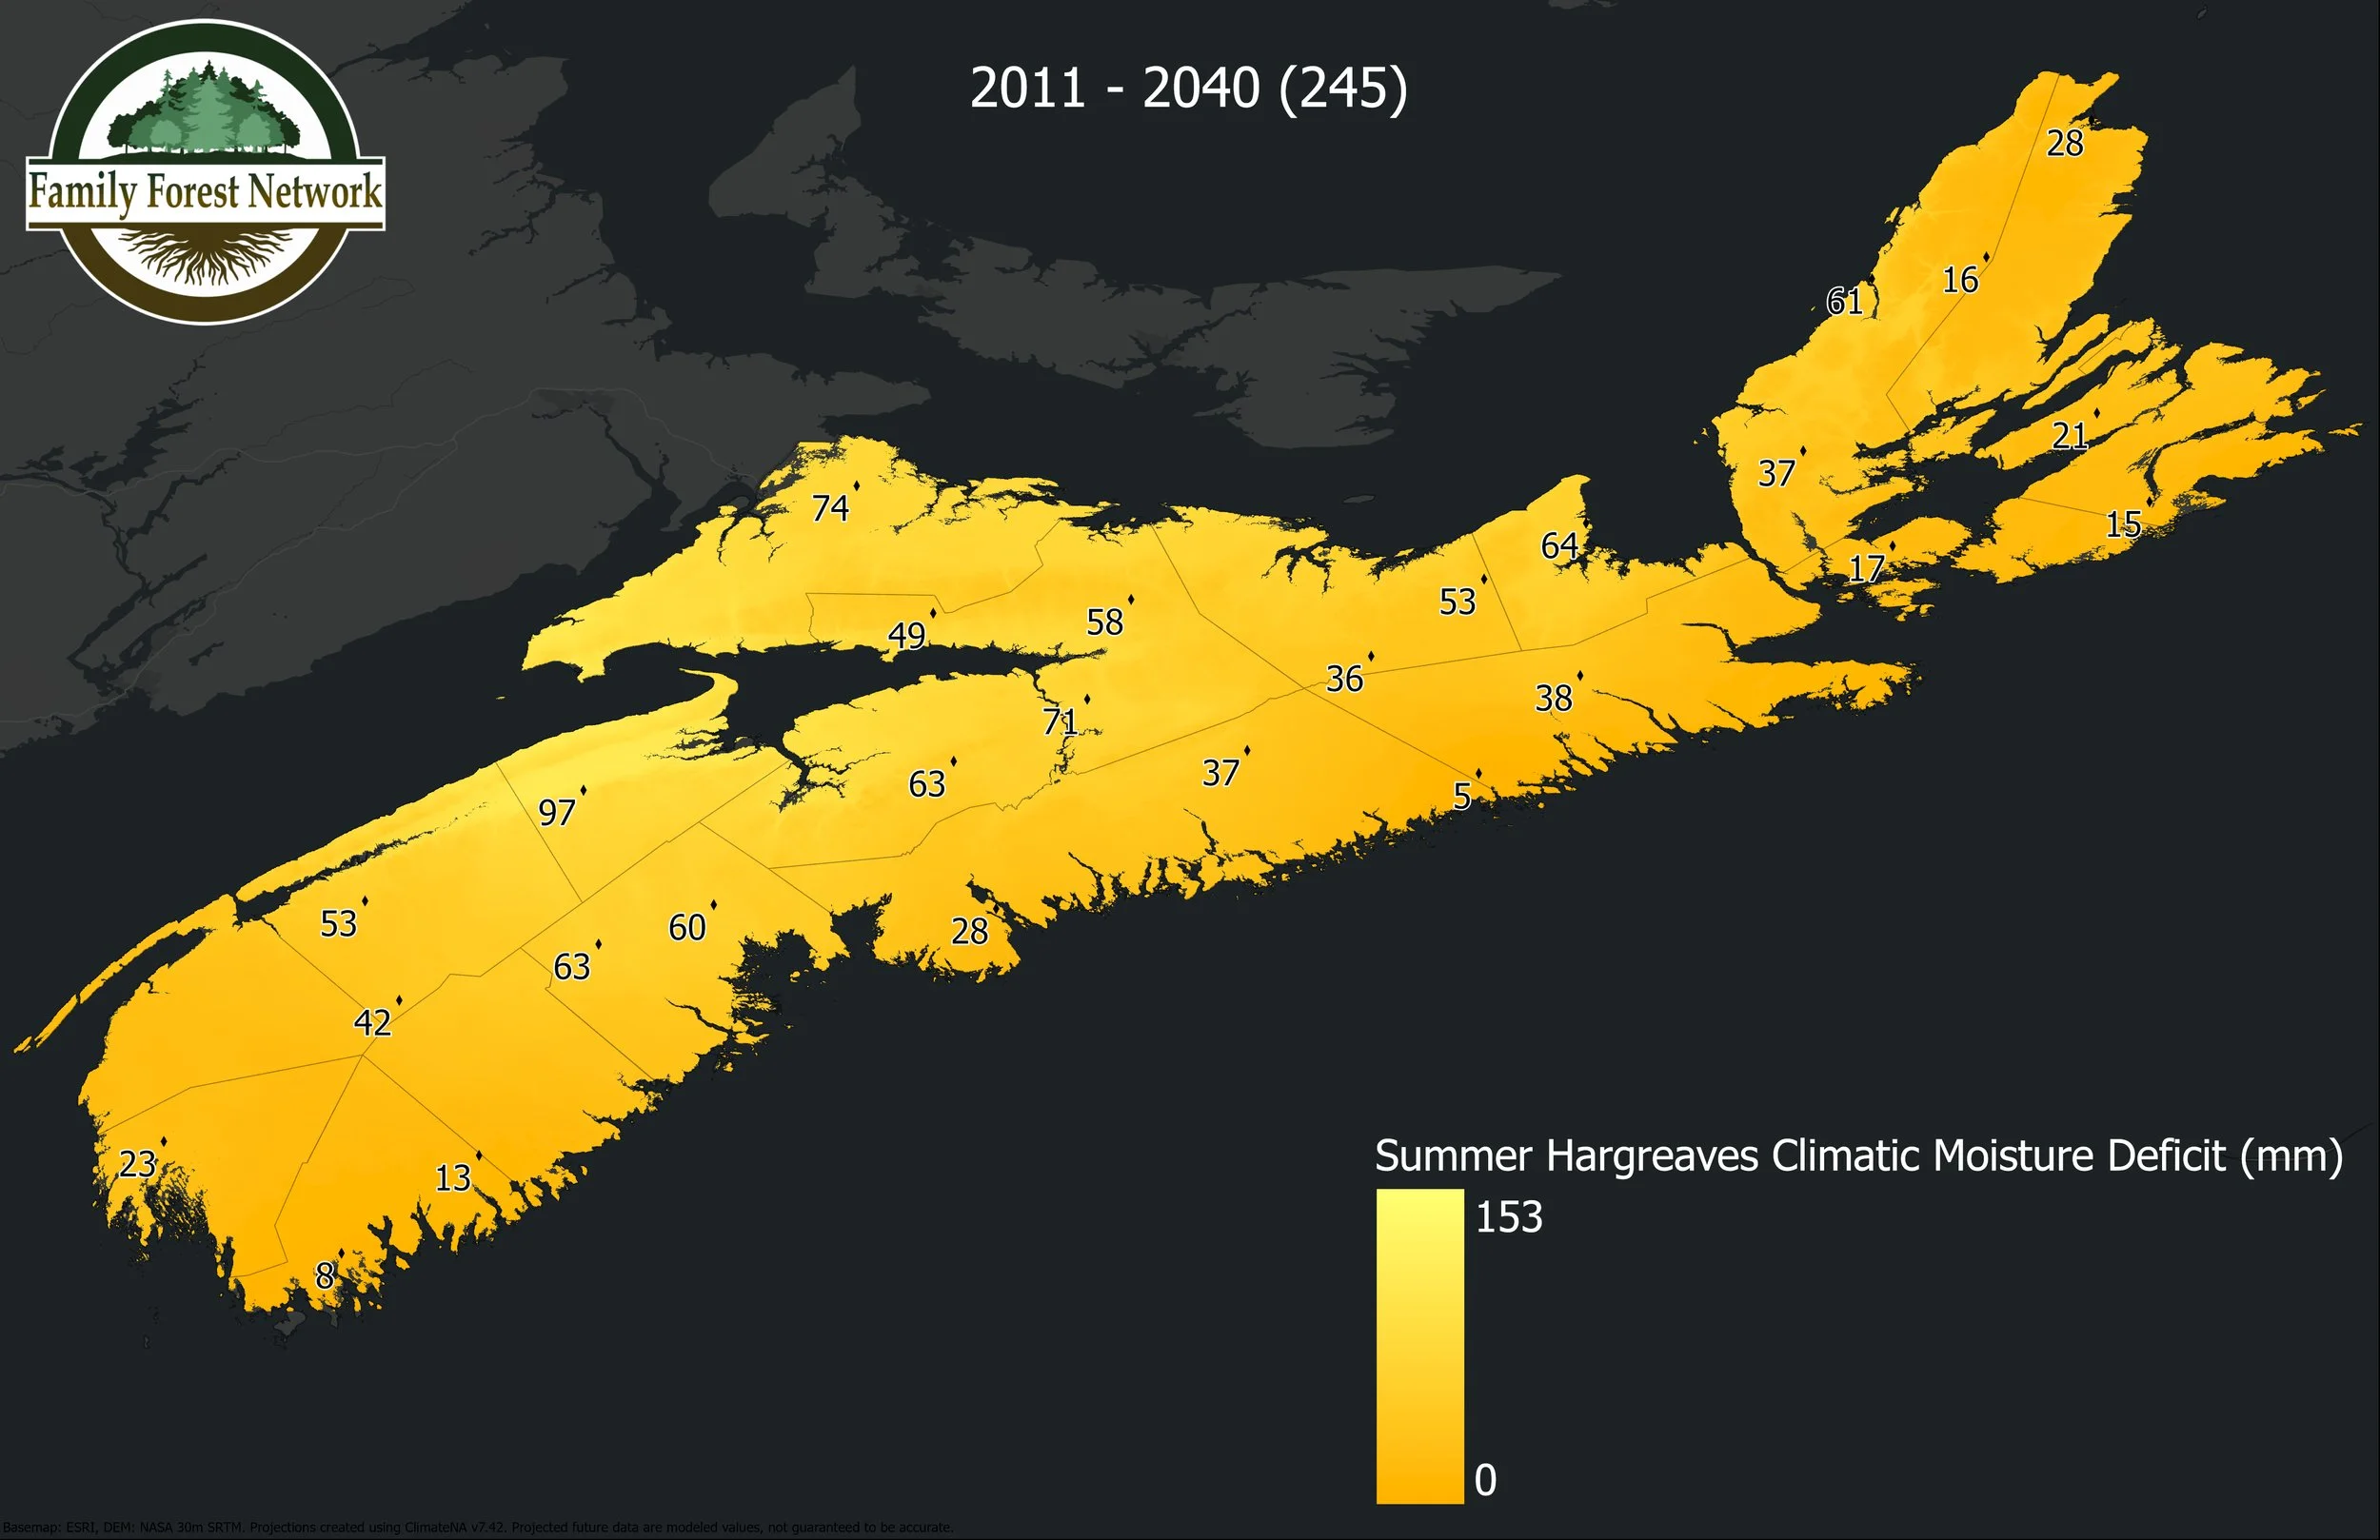
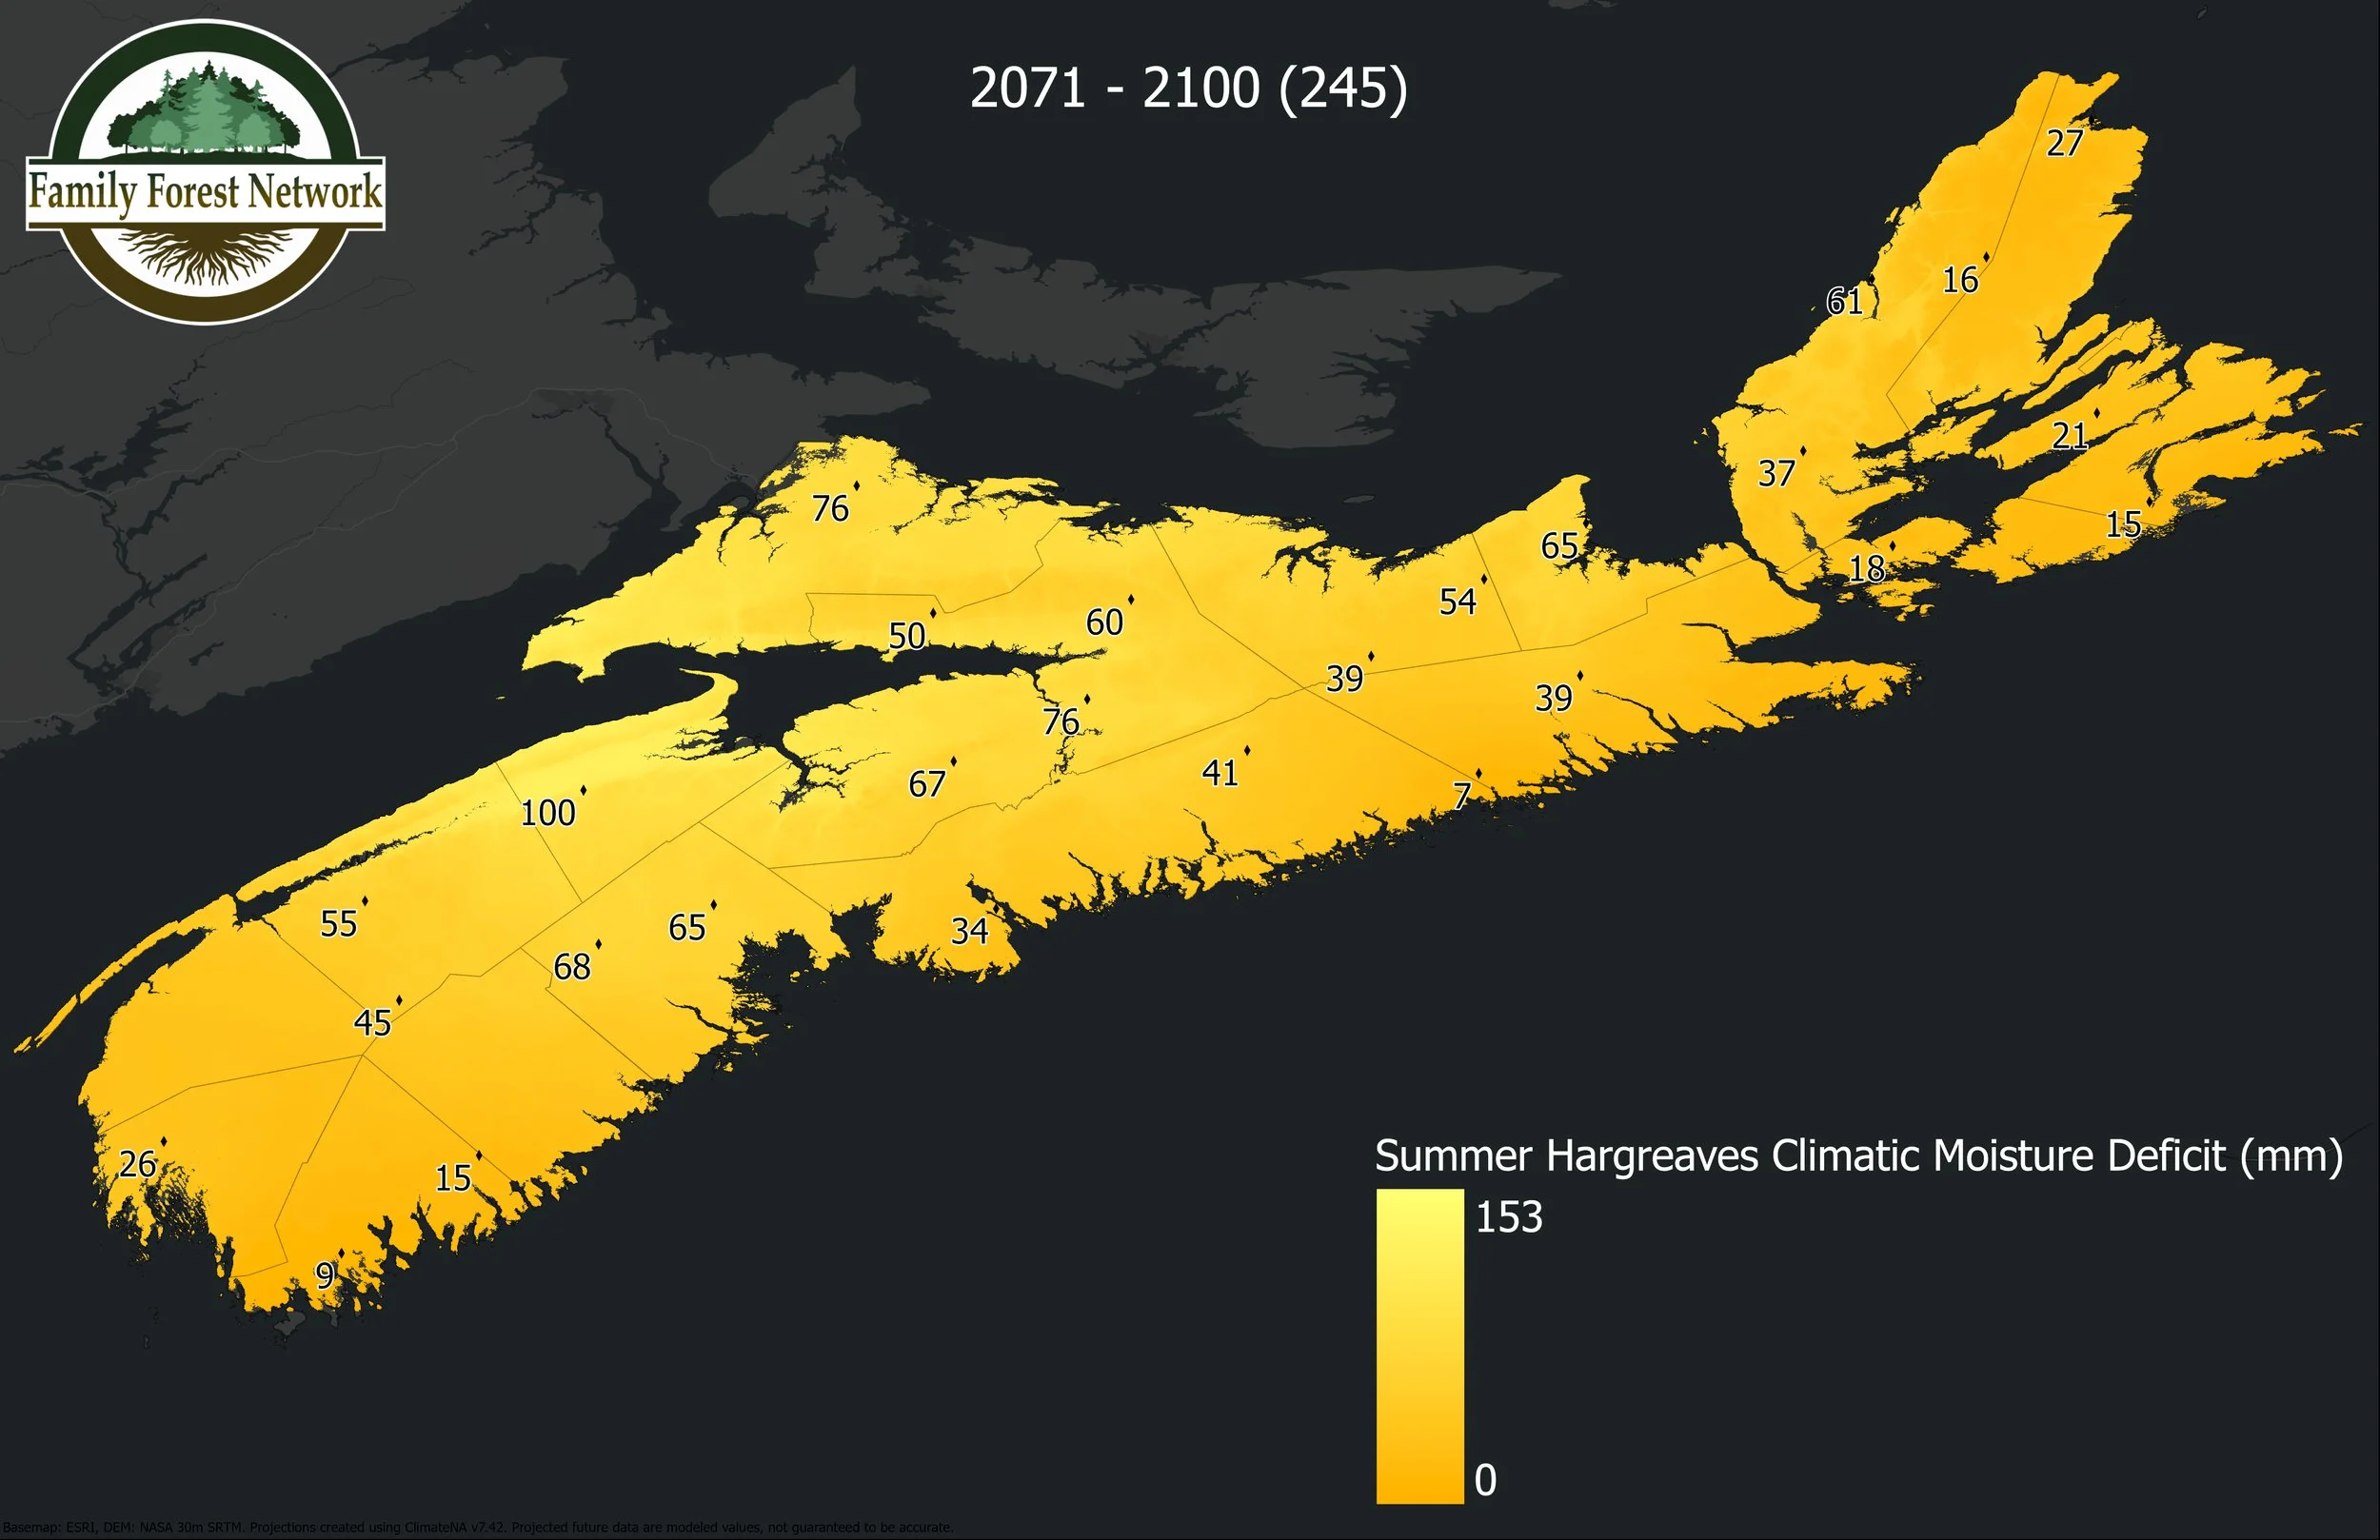
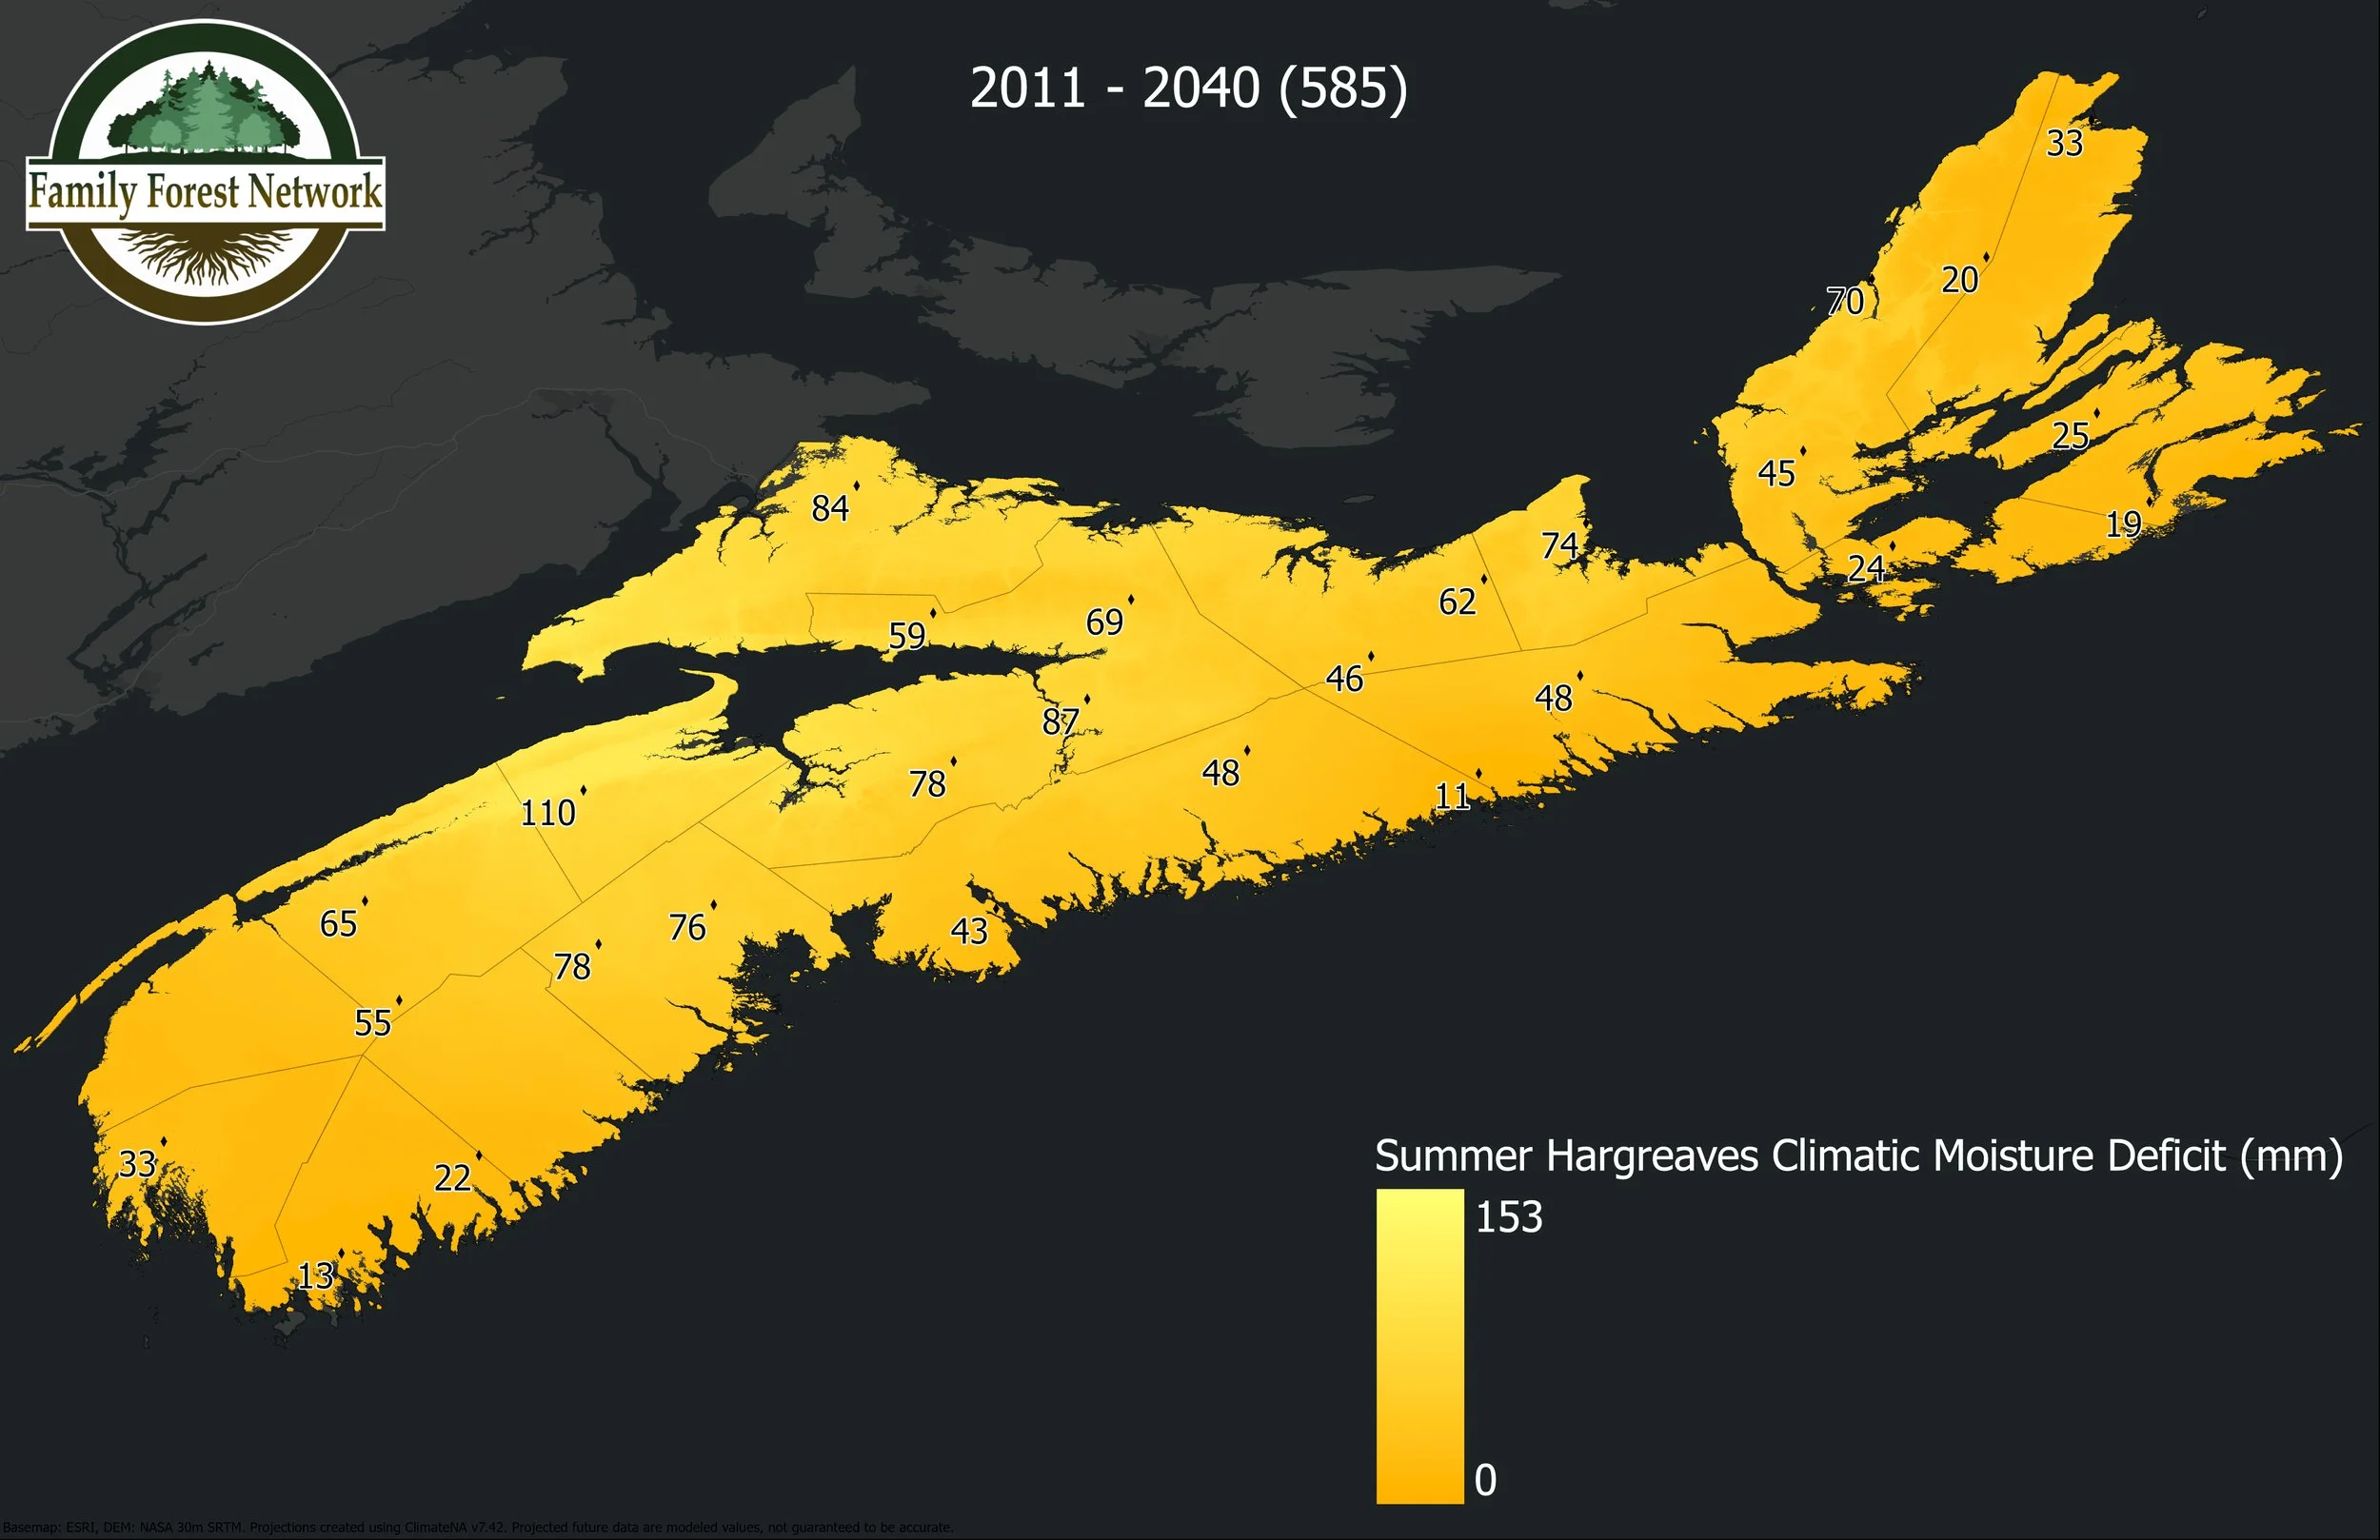
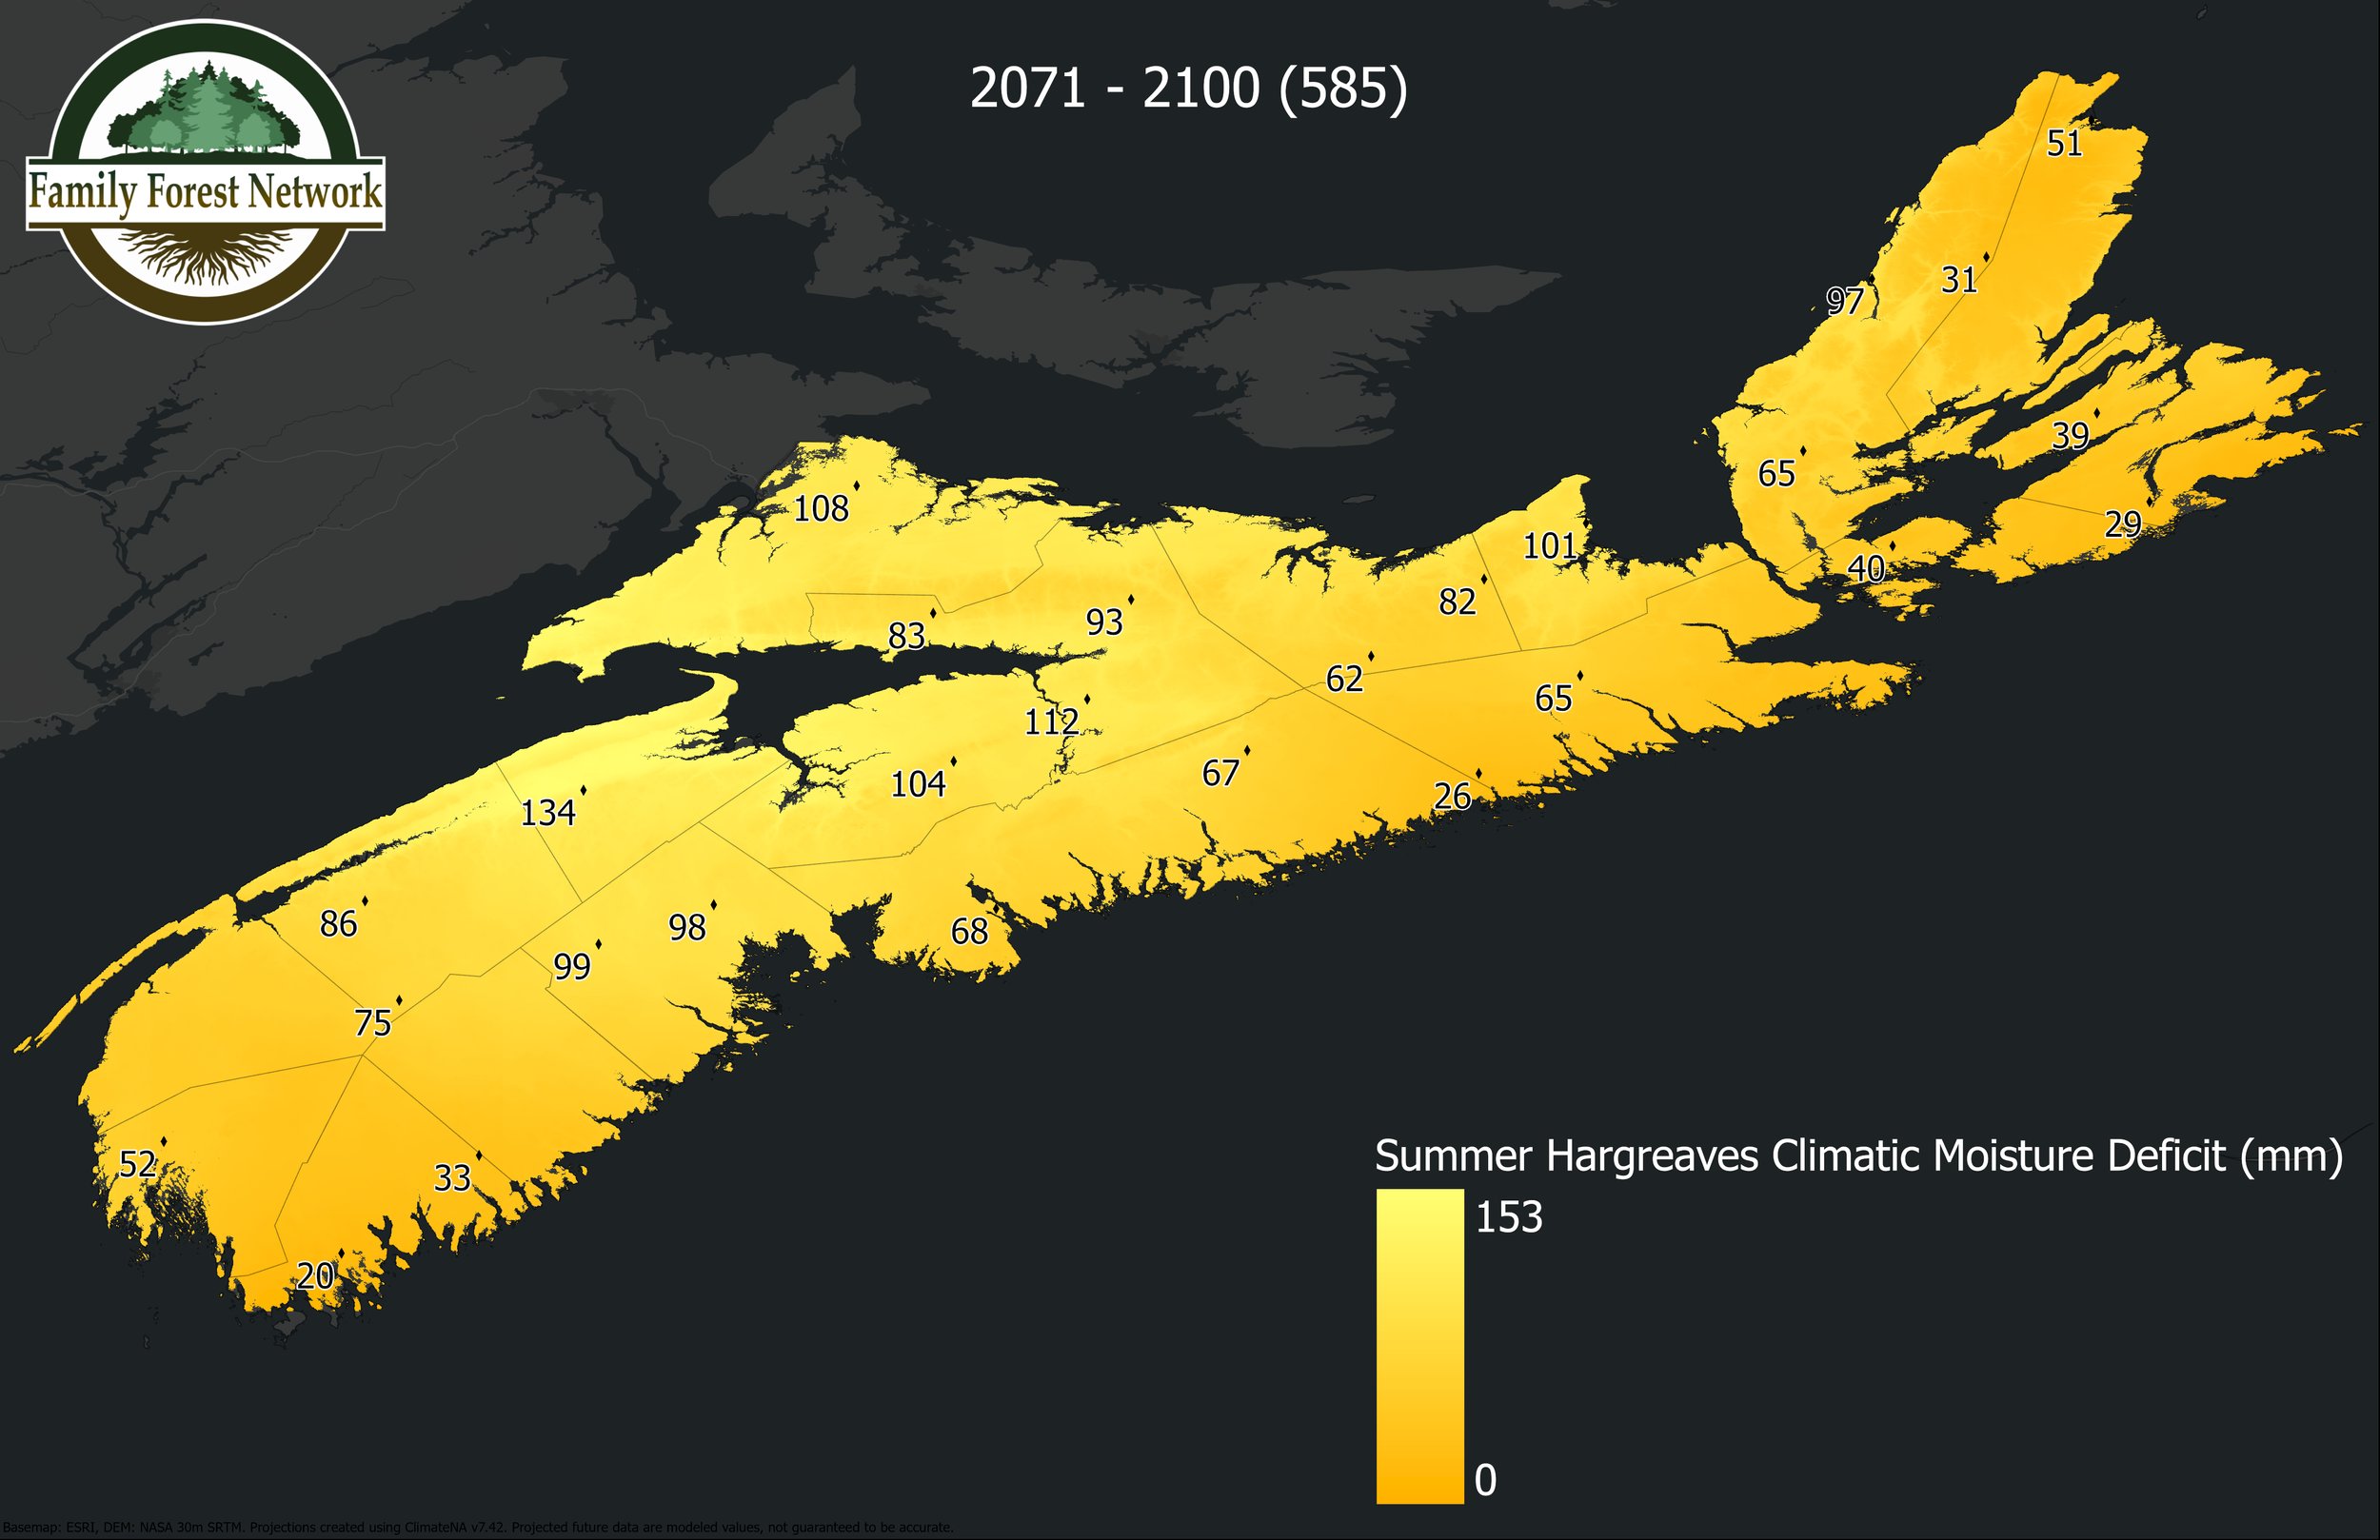
To help show how climate change may affect forest conditions in Nova Scotia, Family Forest Network staff have generated provincial maps showing projected values for several climate related variables that affect forest ecosystem function and health. These maps show the 1961-1990 baseline (Normal) period derived from measured data, as well as maps of current and end-of-century projections.
Two projected climate scenarios were used for this exercise, representing what we call an optimistic development scenario (SSP2-45 “Middle of the Road”) and a pessimistic development scenario (SSP5-85 Fossil-Fueled Development). 1 All data were generated using the ClimateNA software package (v7.42 , 2023) (Home Page - ClimateNA).
Ranges in climate variable values are shown using colour ramps supported by scattered location data for easier interpretation. Each variable uses a different colour. Most variables are self evident as to what they represent, but Hargreaves’ Climate Moisture Deficit requires some explanation. Hargreaves’ CMD is a drought‑stress index estimating the difference between atmospheric evaporative demand (natural evapotranspiration) and available precipitation. In general, higher CMD values indicate greater potential drought stress, lower soil moisture, and reduced tree growth potential. In this case, relative changes in CMD values are likely more important than actual values.
Note: It’s important to remember that these climate maps are not predictions of future conditions, but only projections based on scenario assumptions. There is uncertainty both in how representative these scenarios are, as well as in modelled outputs based on these scenarios. In that sense, trends in climate variable values would be more reliable than actual values. Each image can be clicked on to enlarge it and see more detail.
1. SSP stands for Shared Socioeconomic Pathway as defined in the Sixth Assessment Report of the IPCC (Intergovernmental Panel on Climate Change). SSPs outline different world-wide development scenarios, each associated with a Radiative Forcing value that is linked to projected increases in average temperature