Climate Variable Ranges for Common Tree Species in Nova Scotia
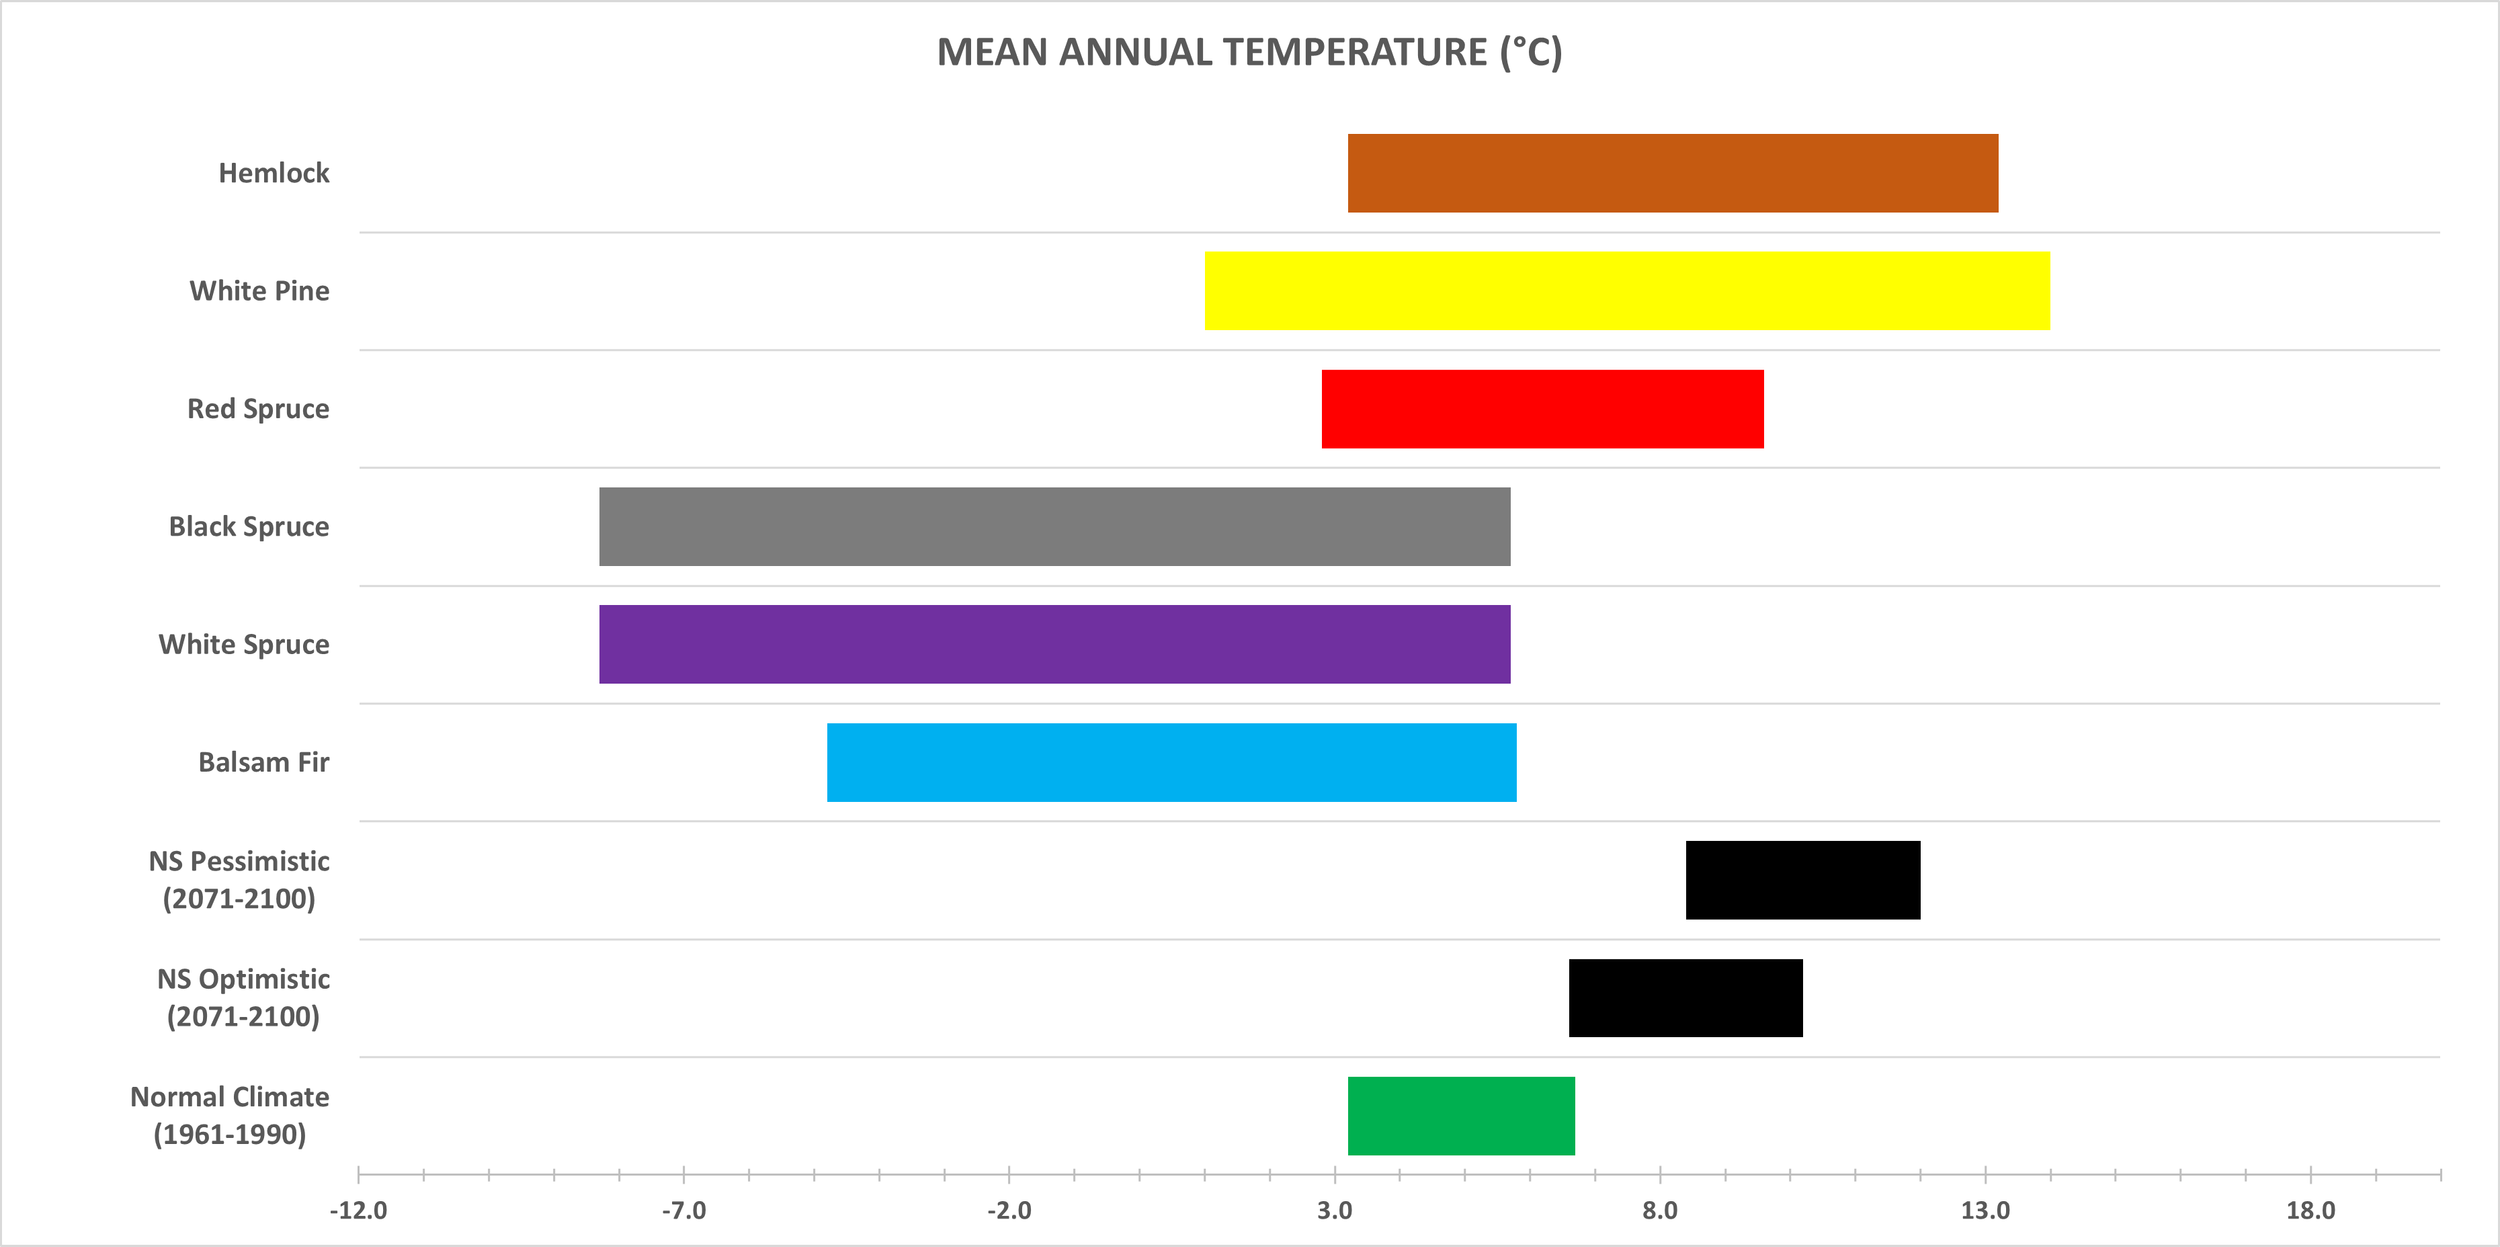
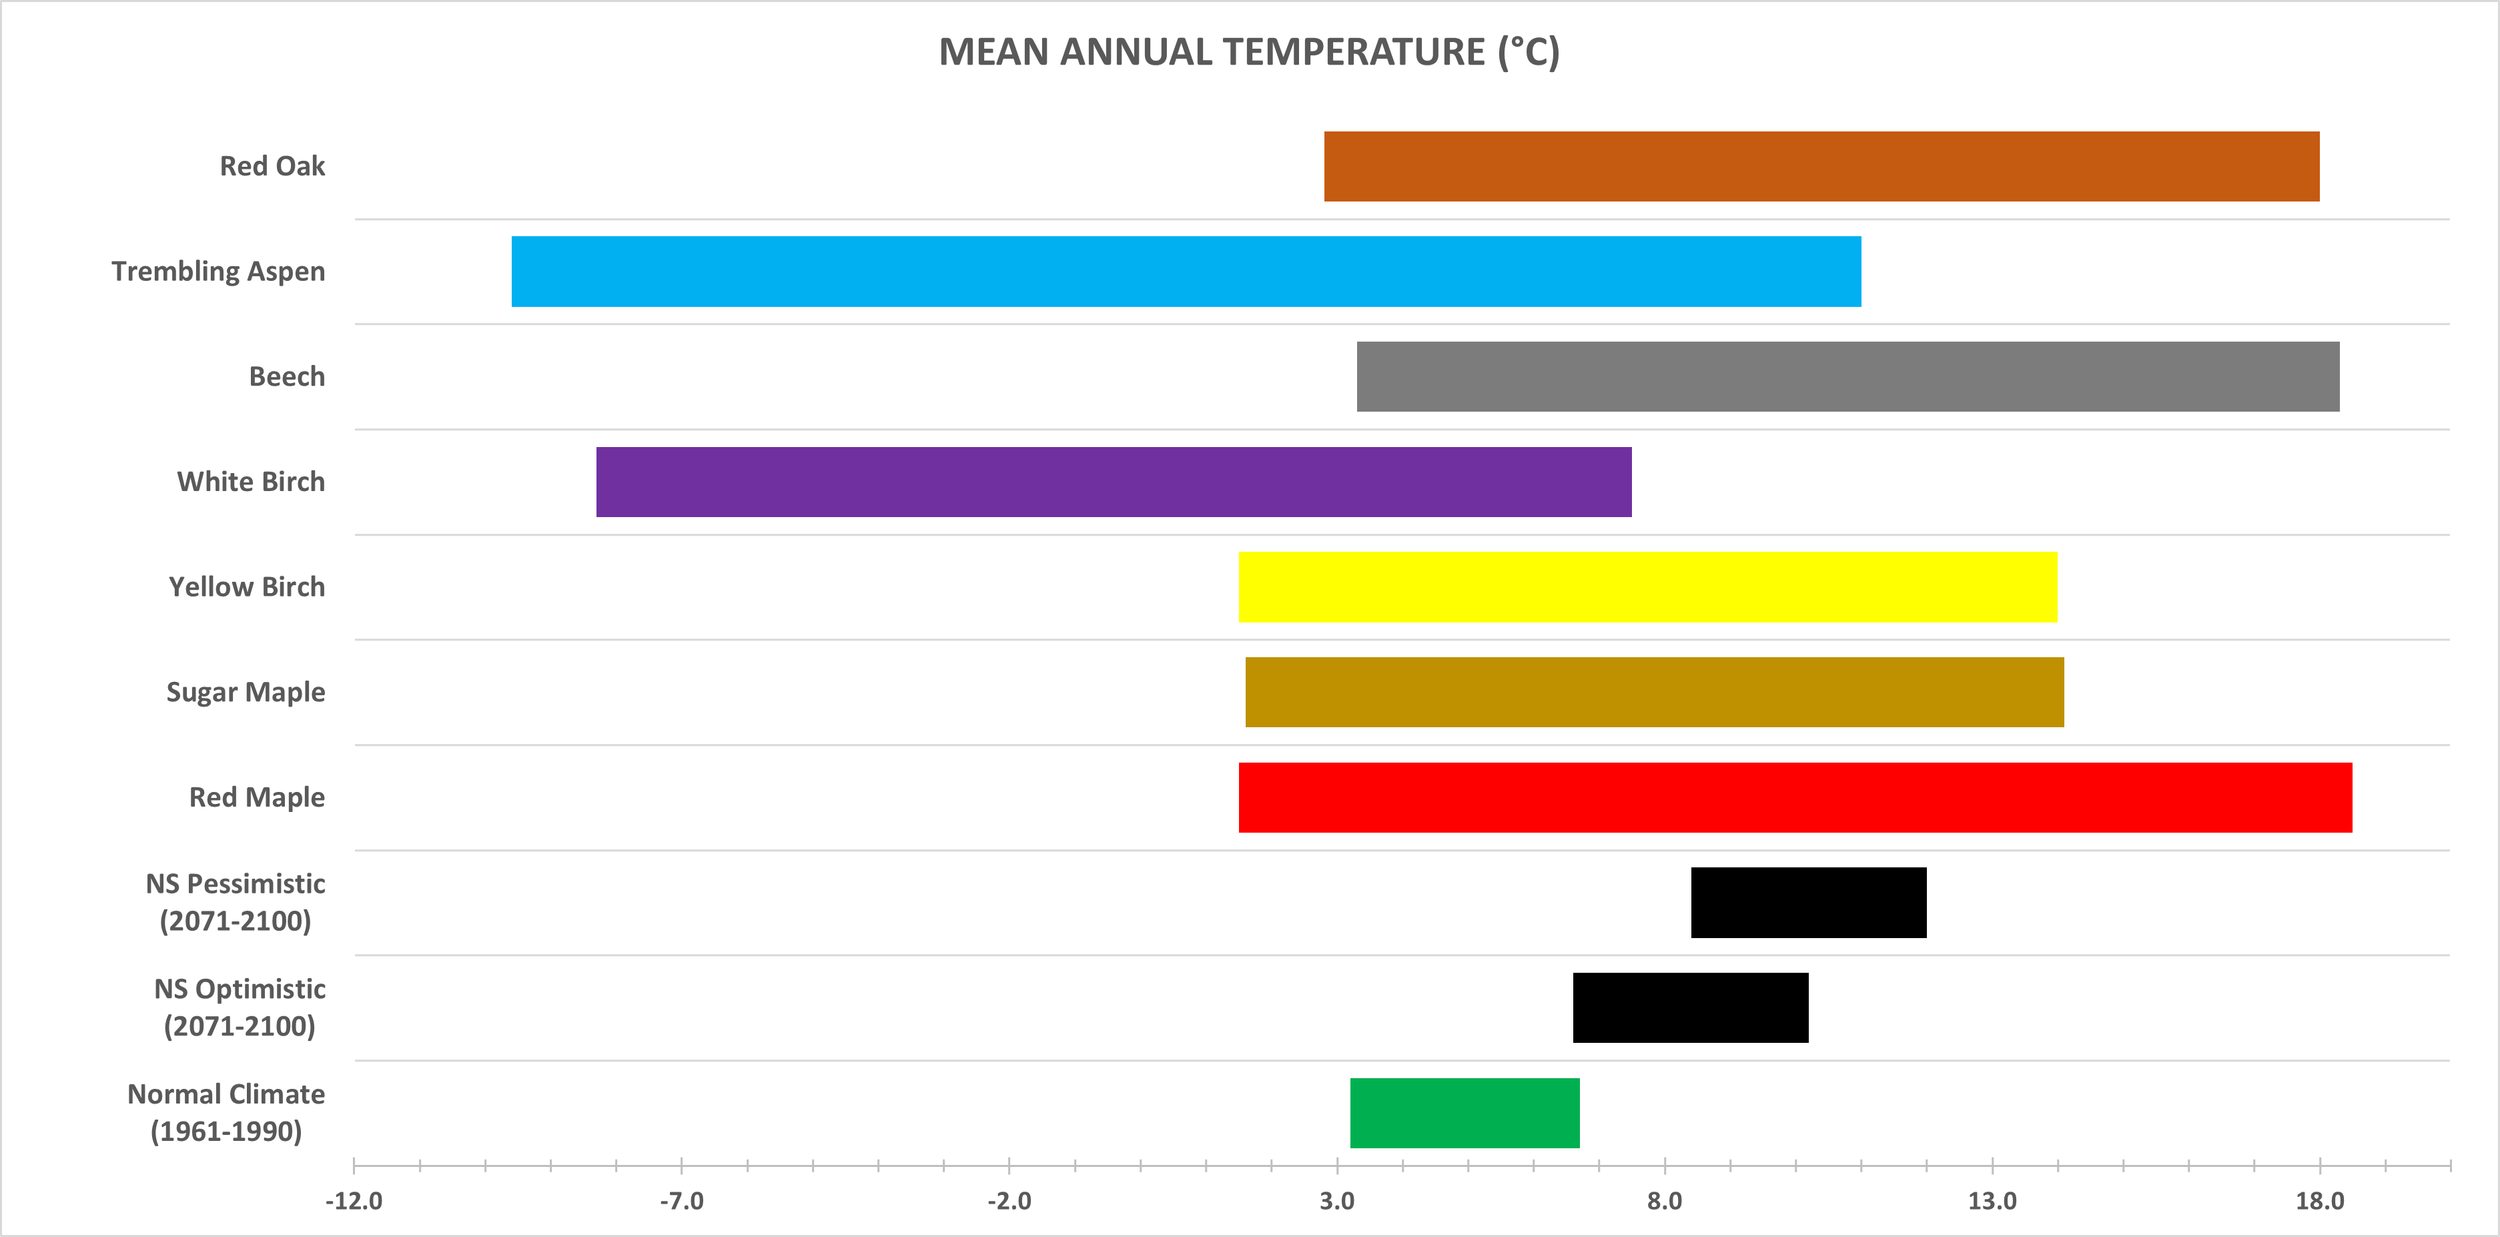
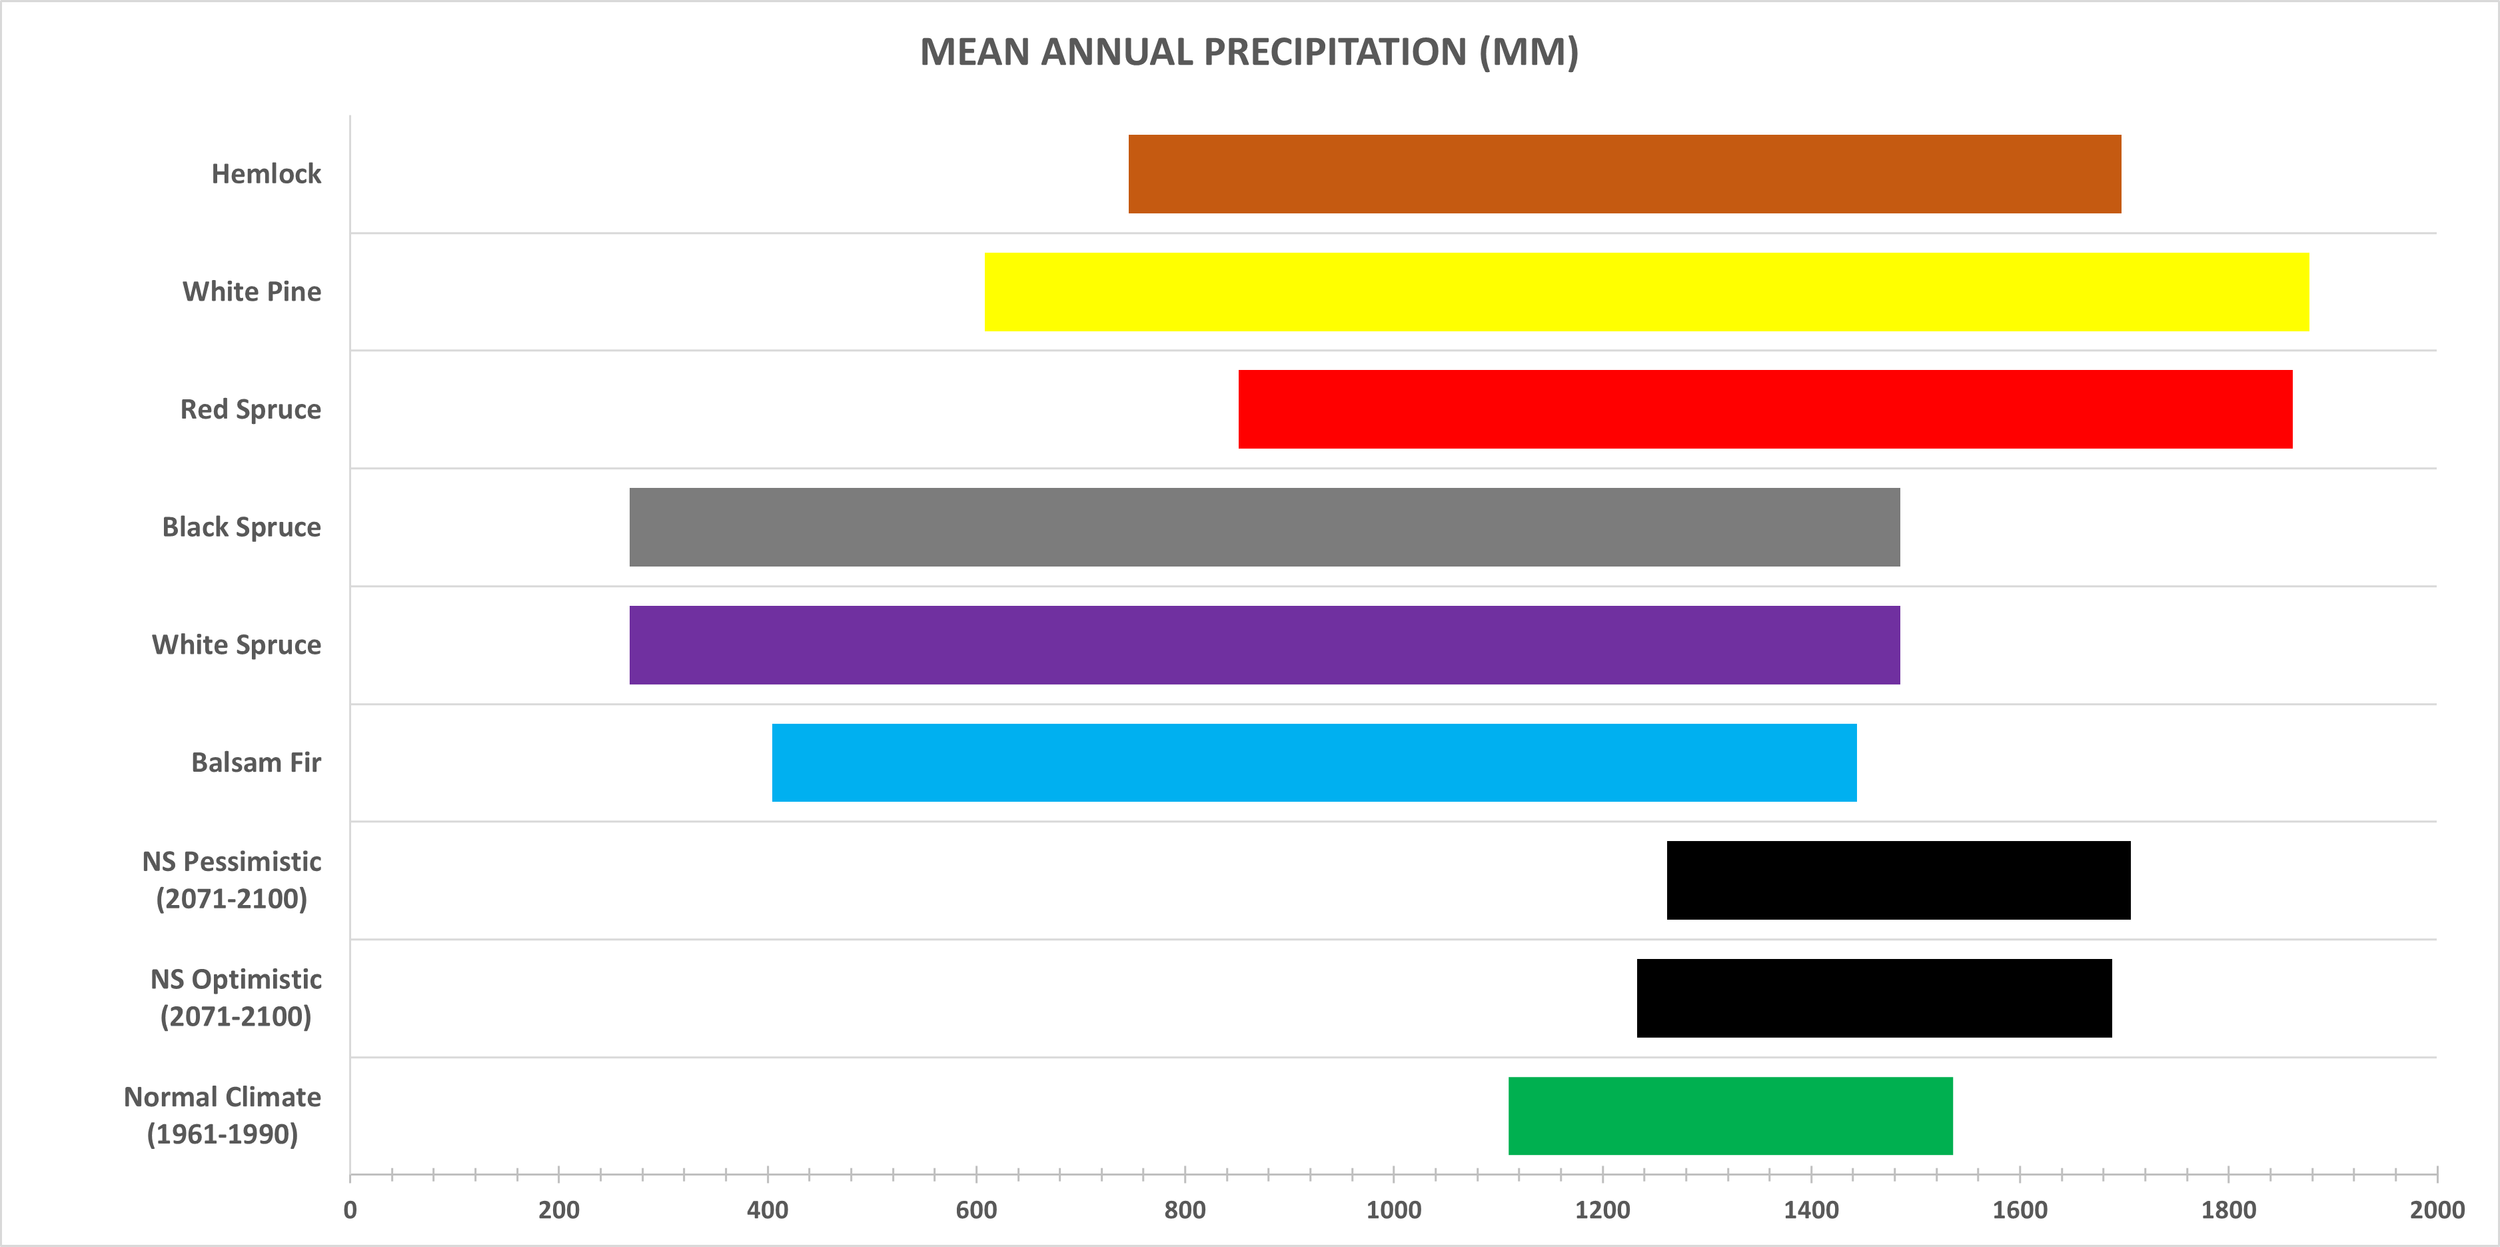
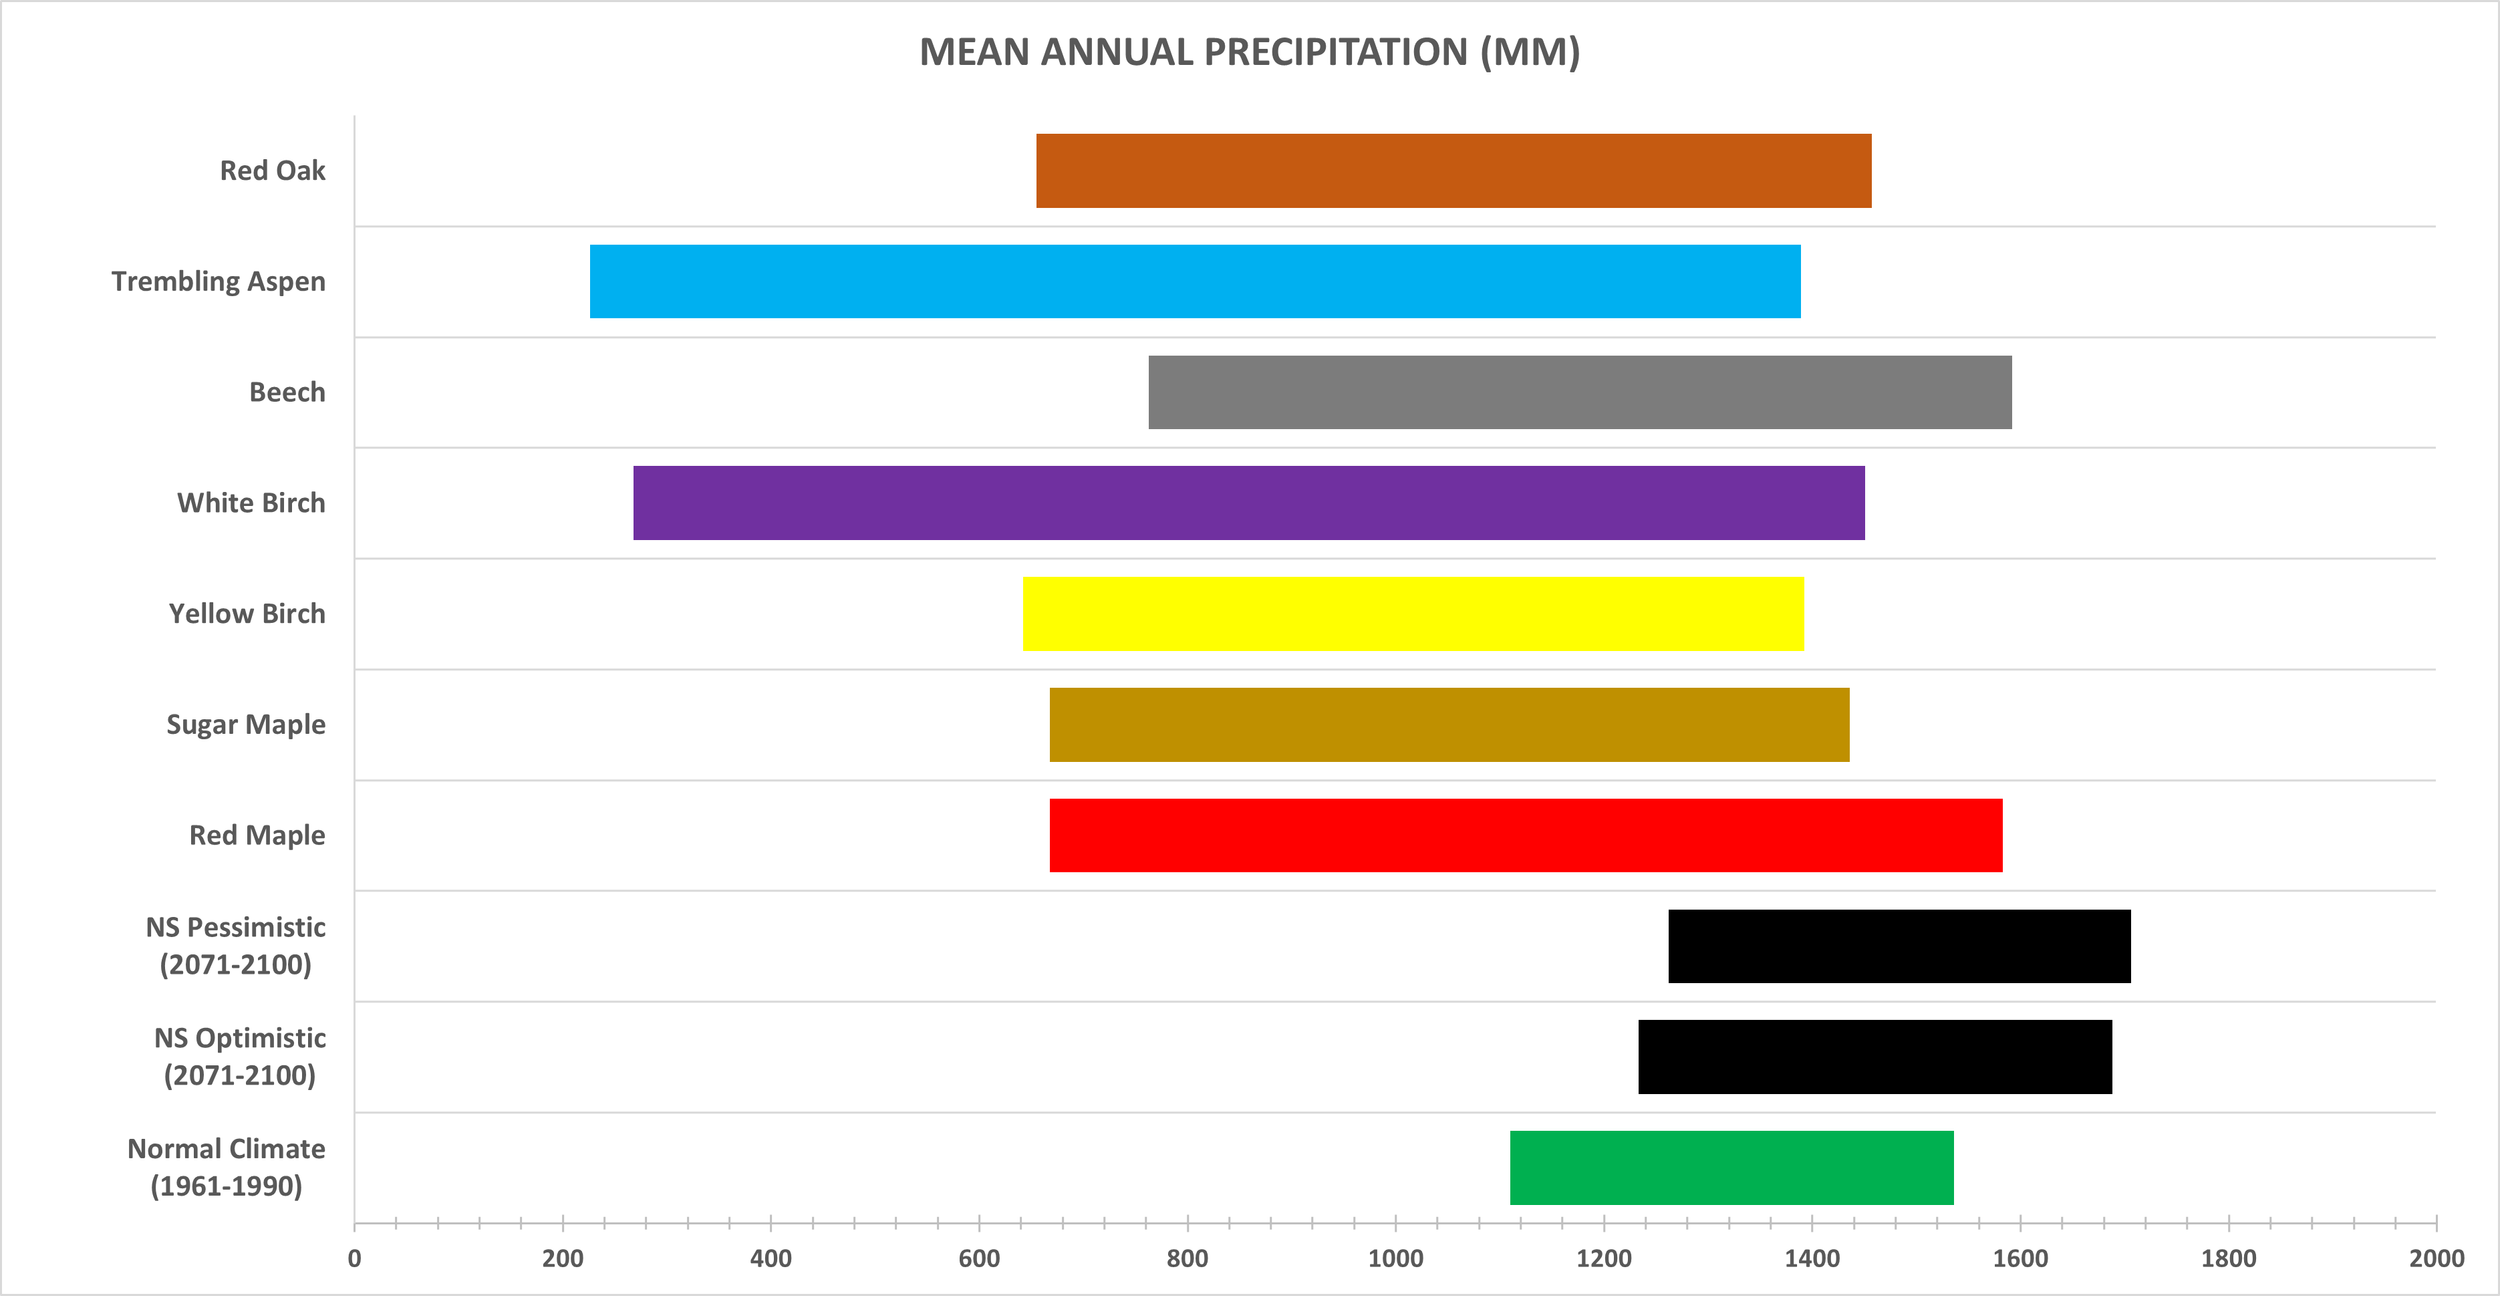
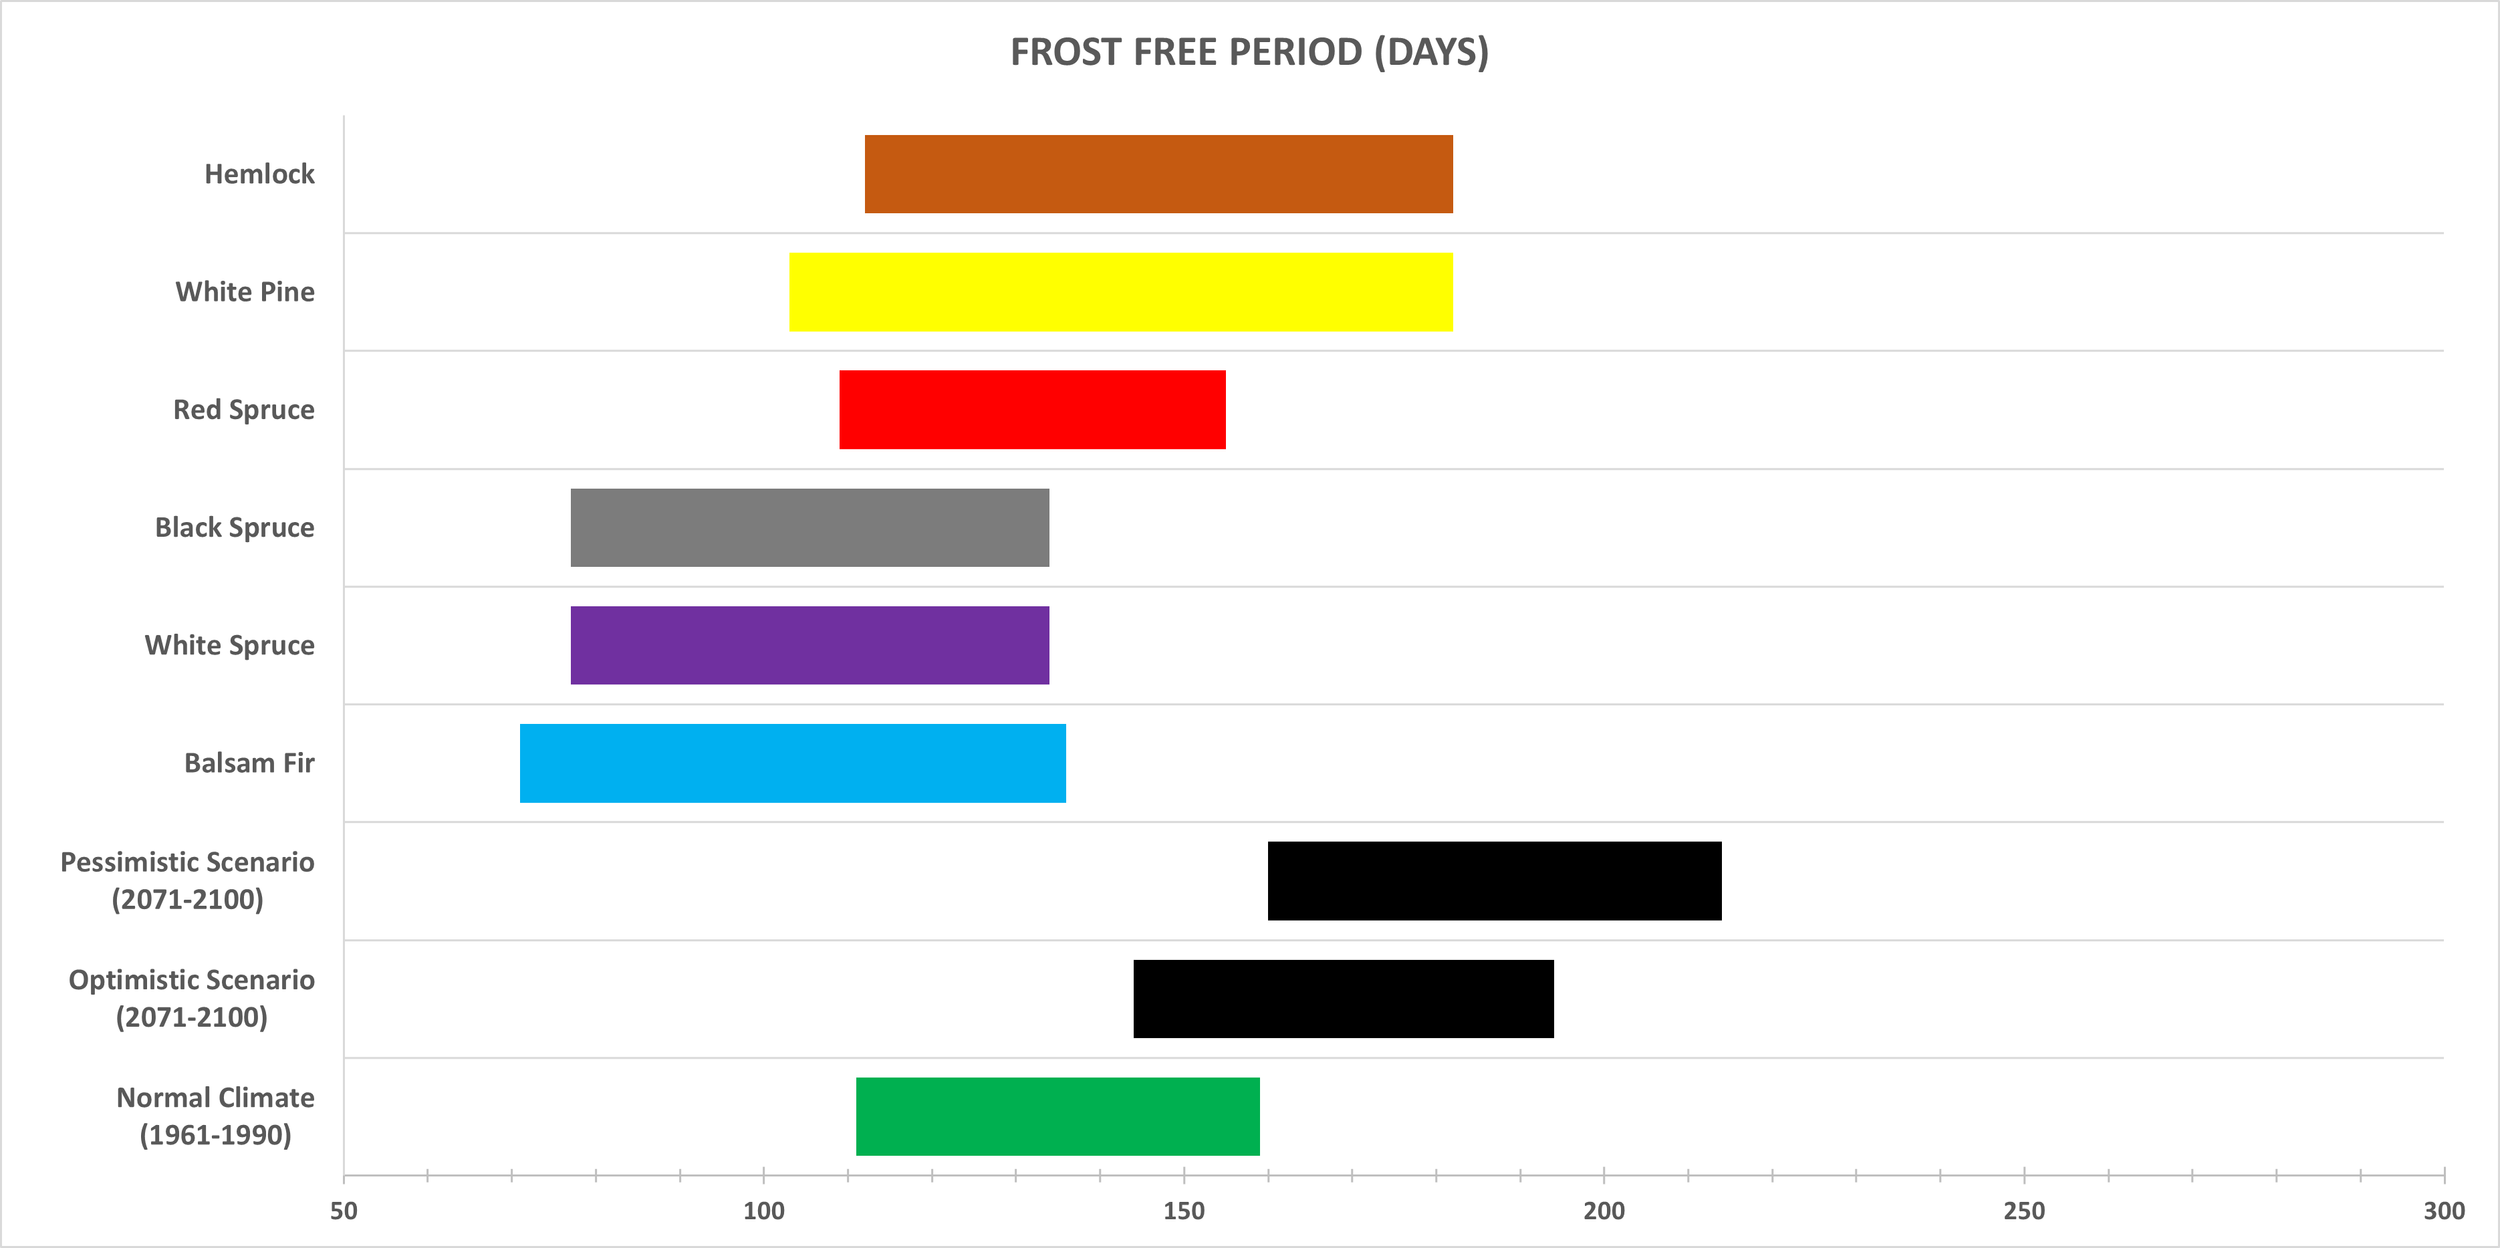
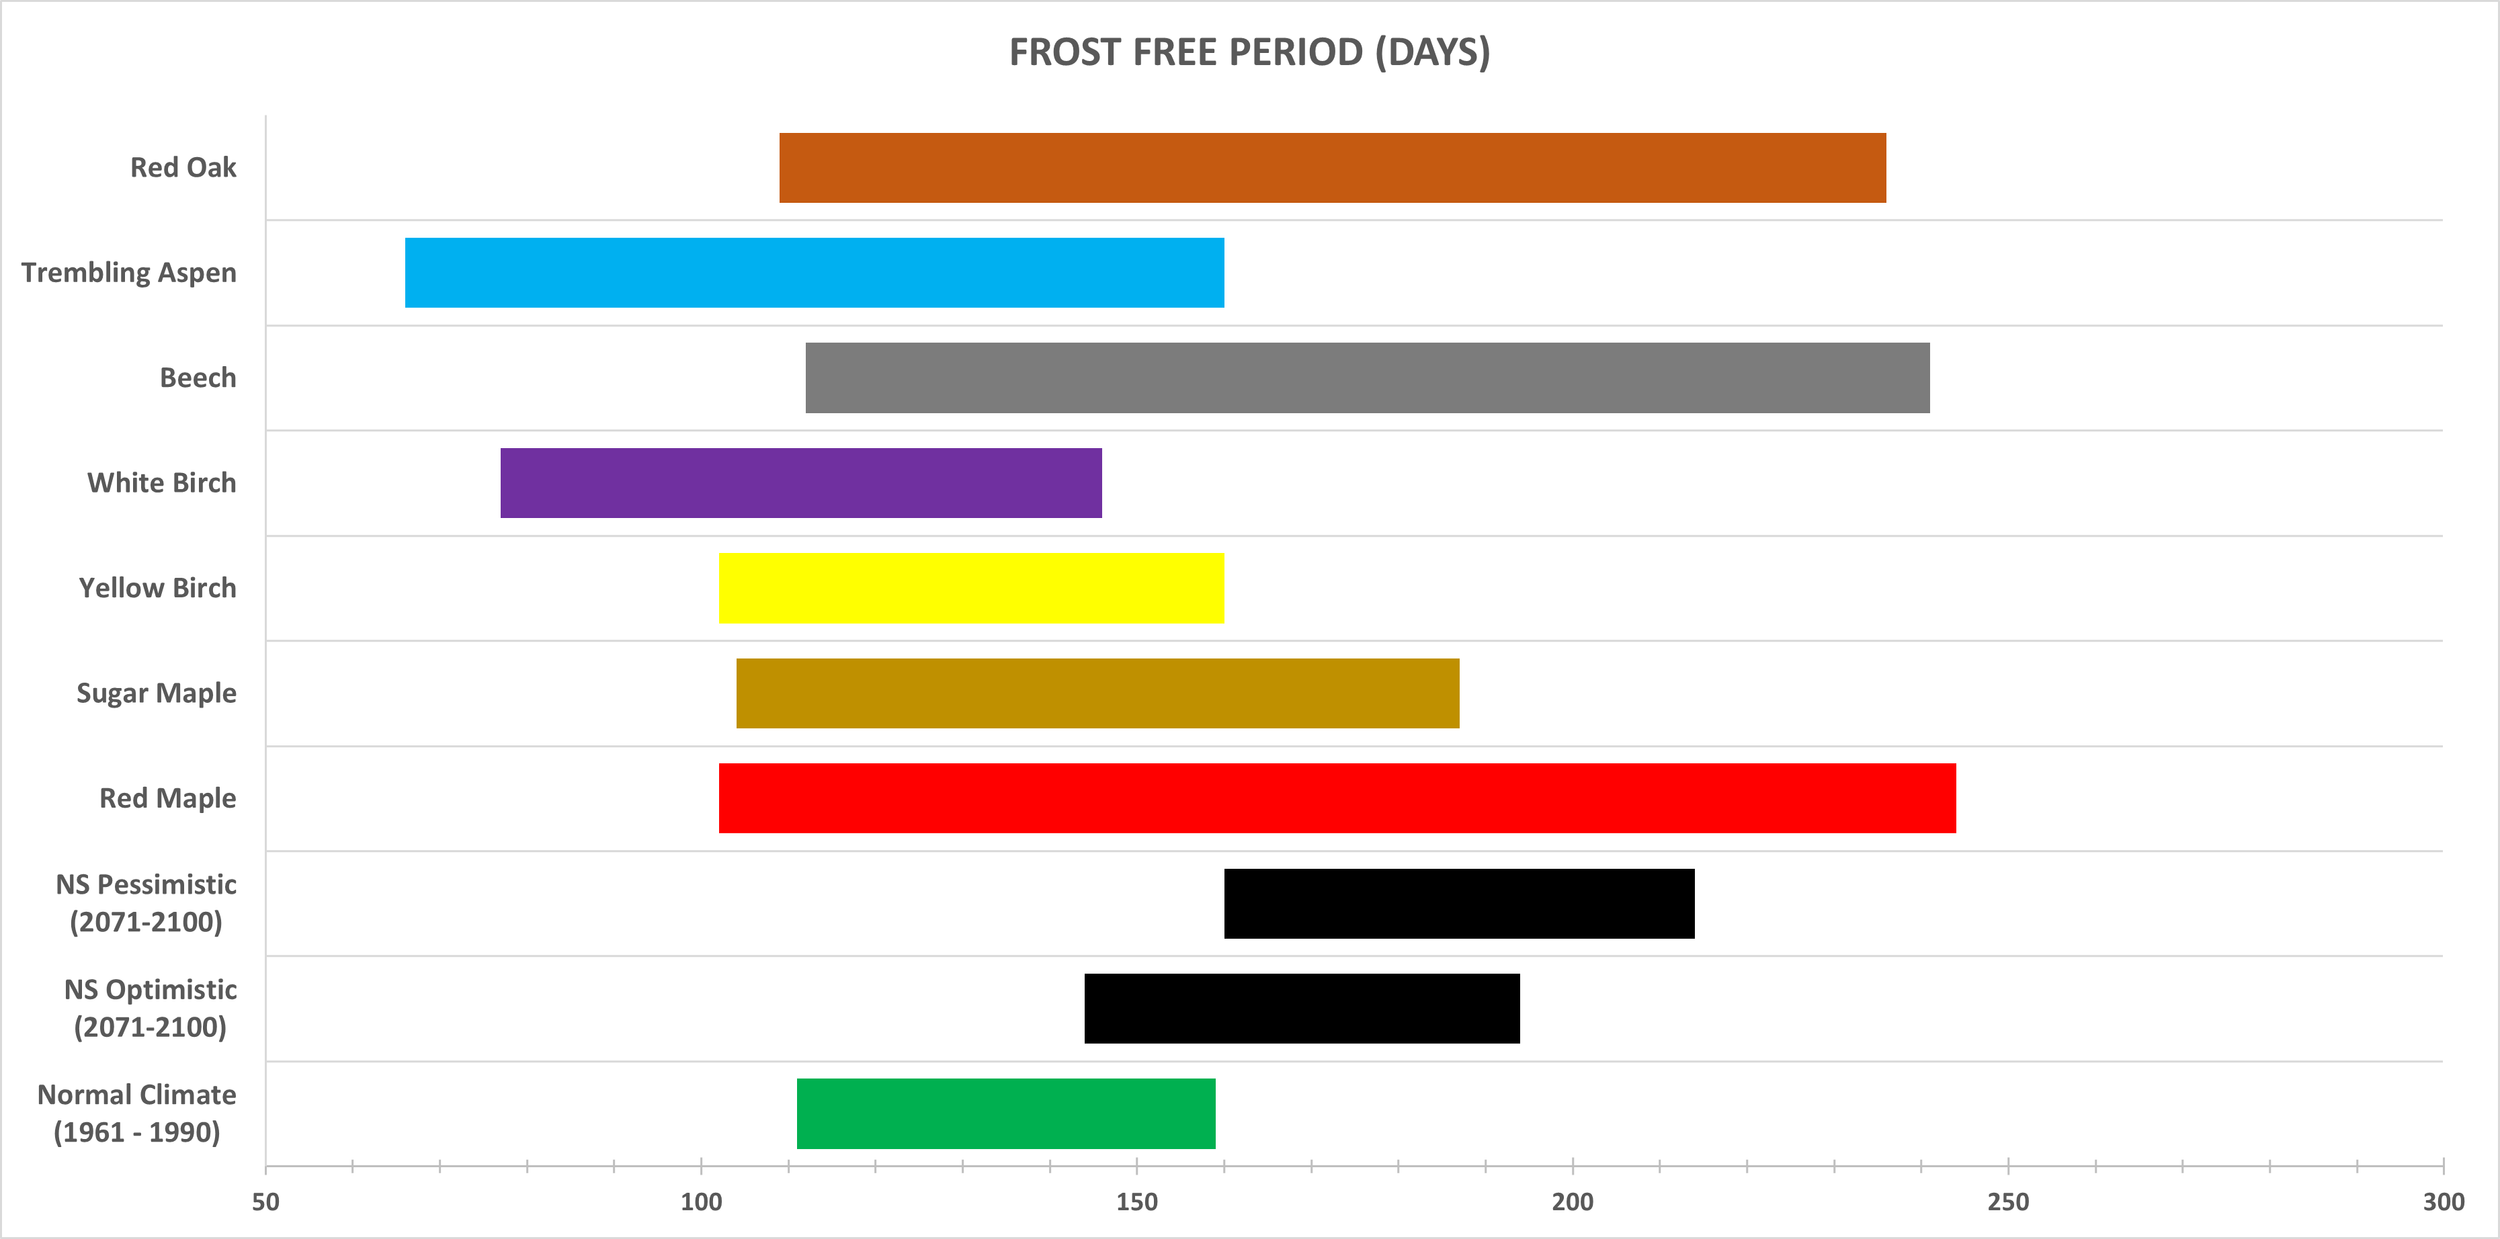
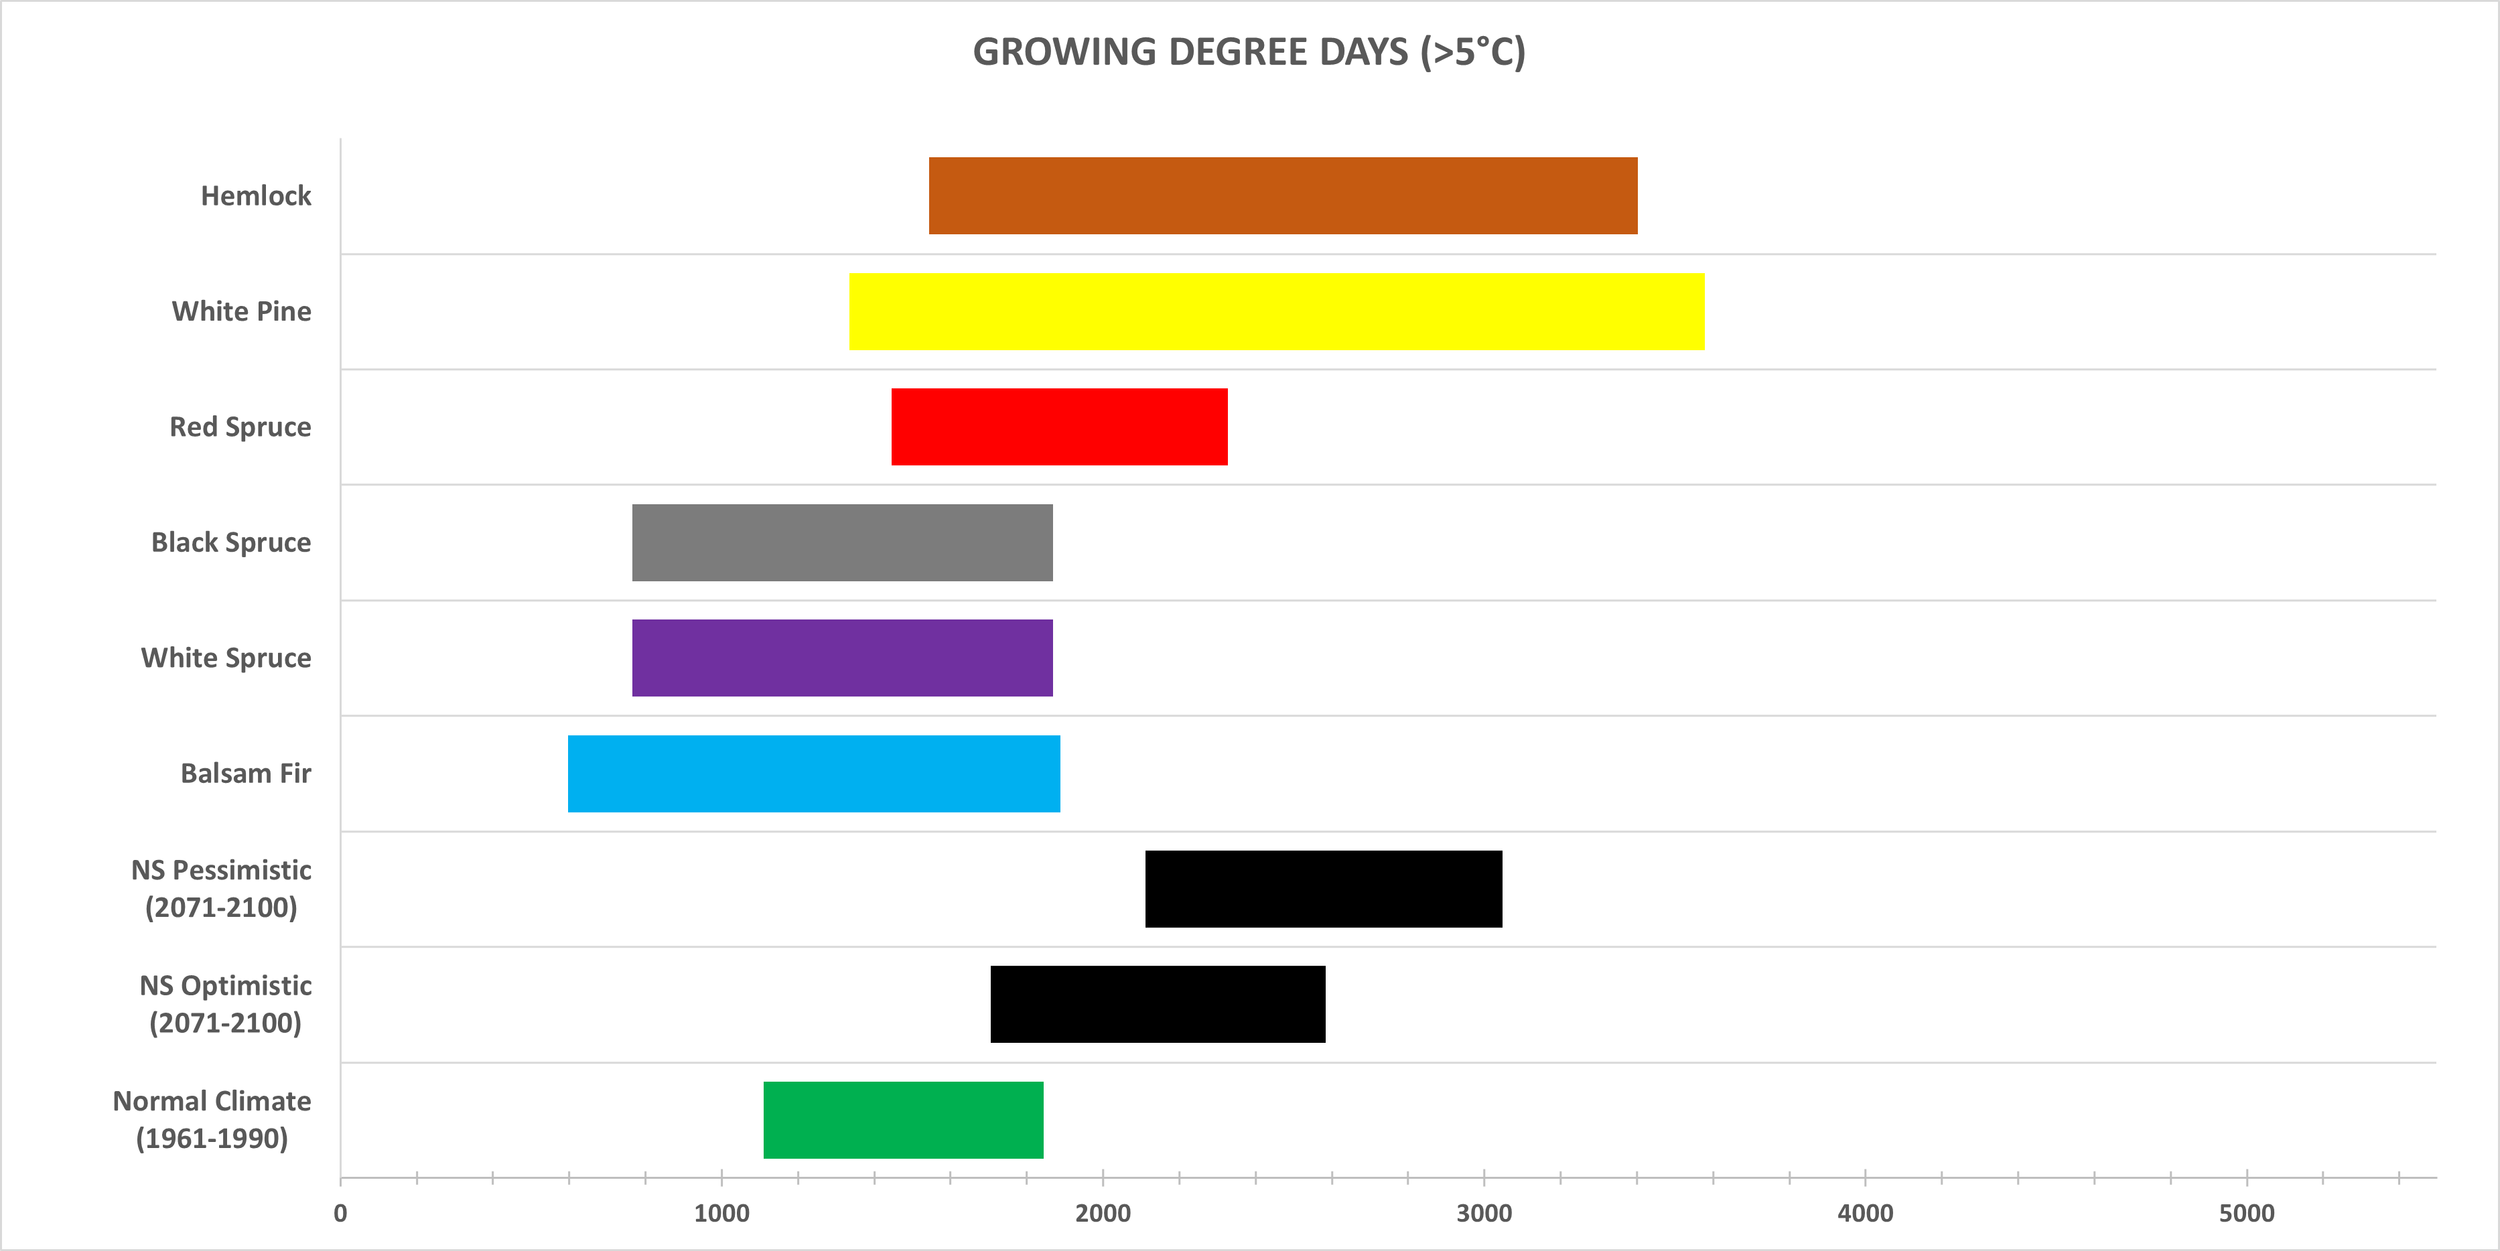
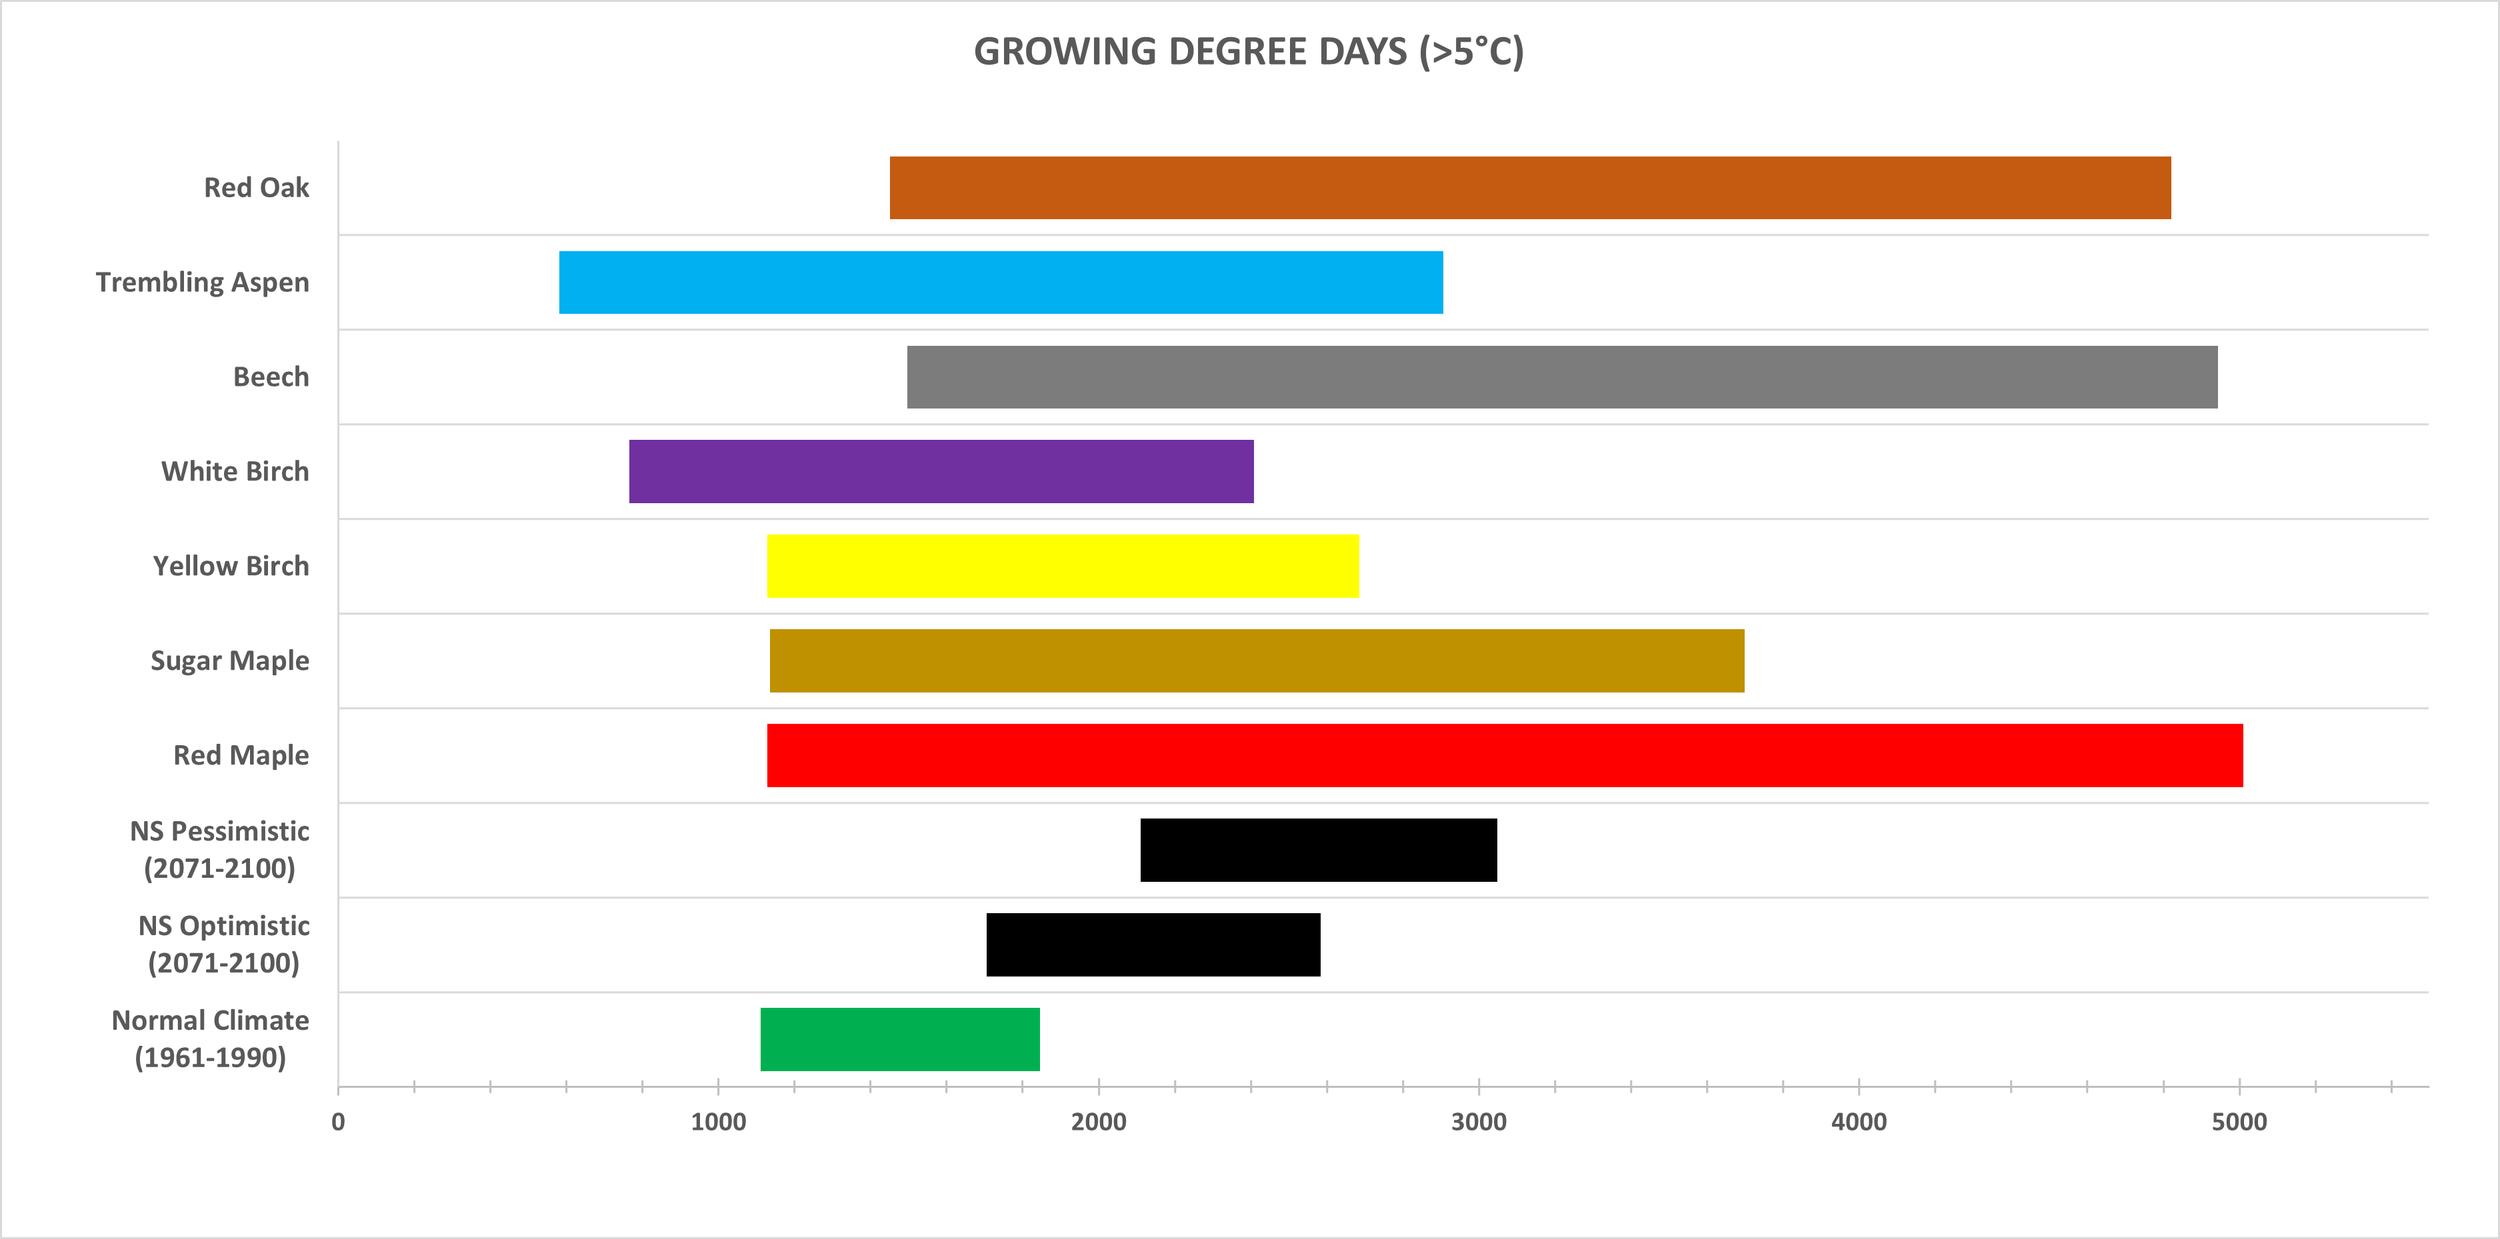
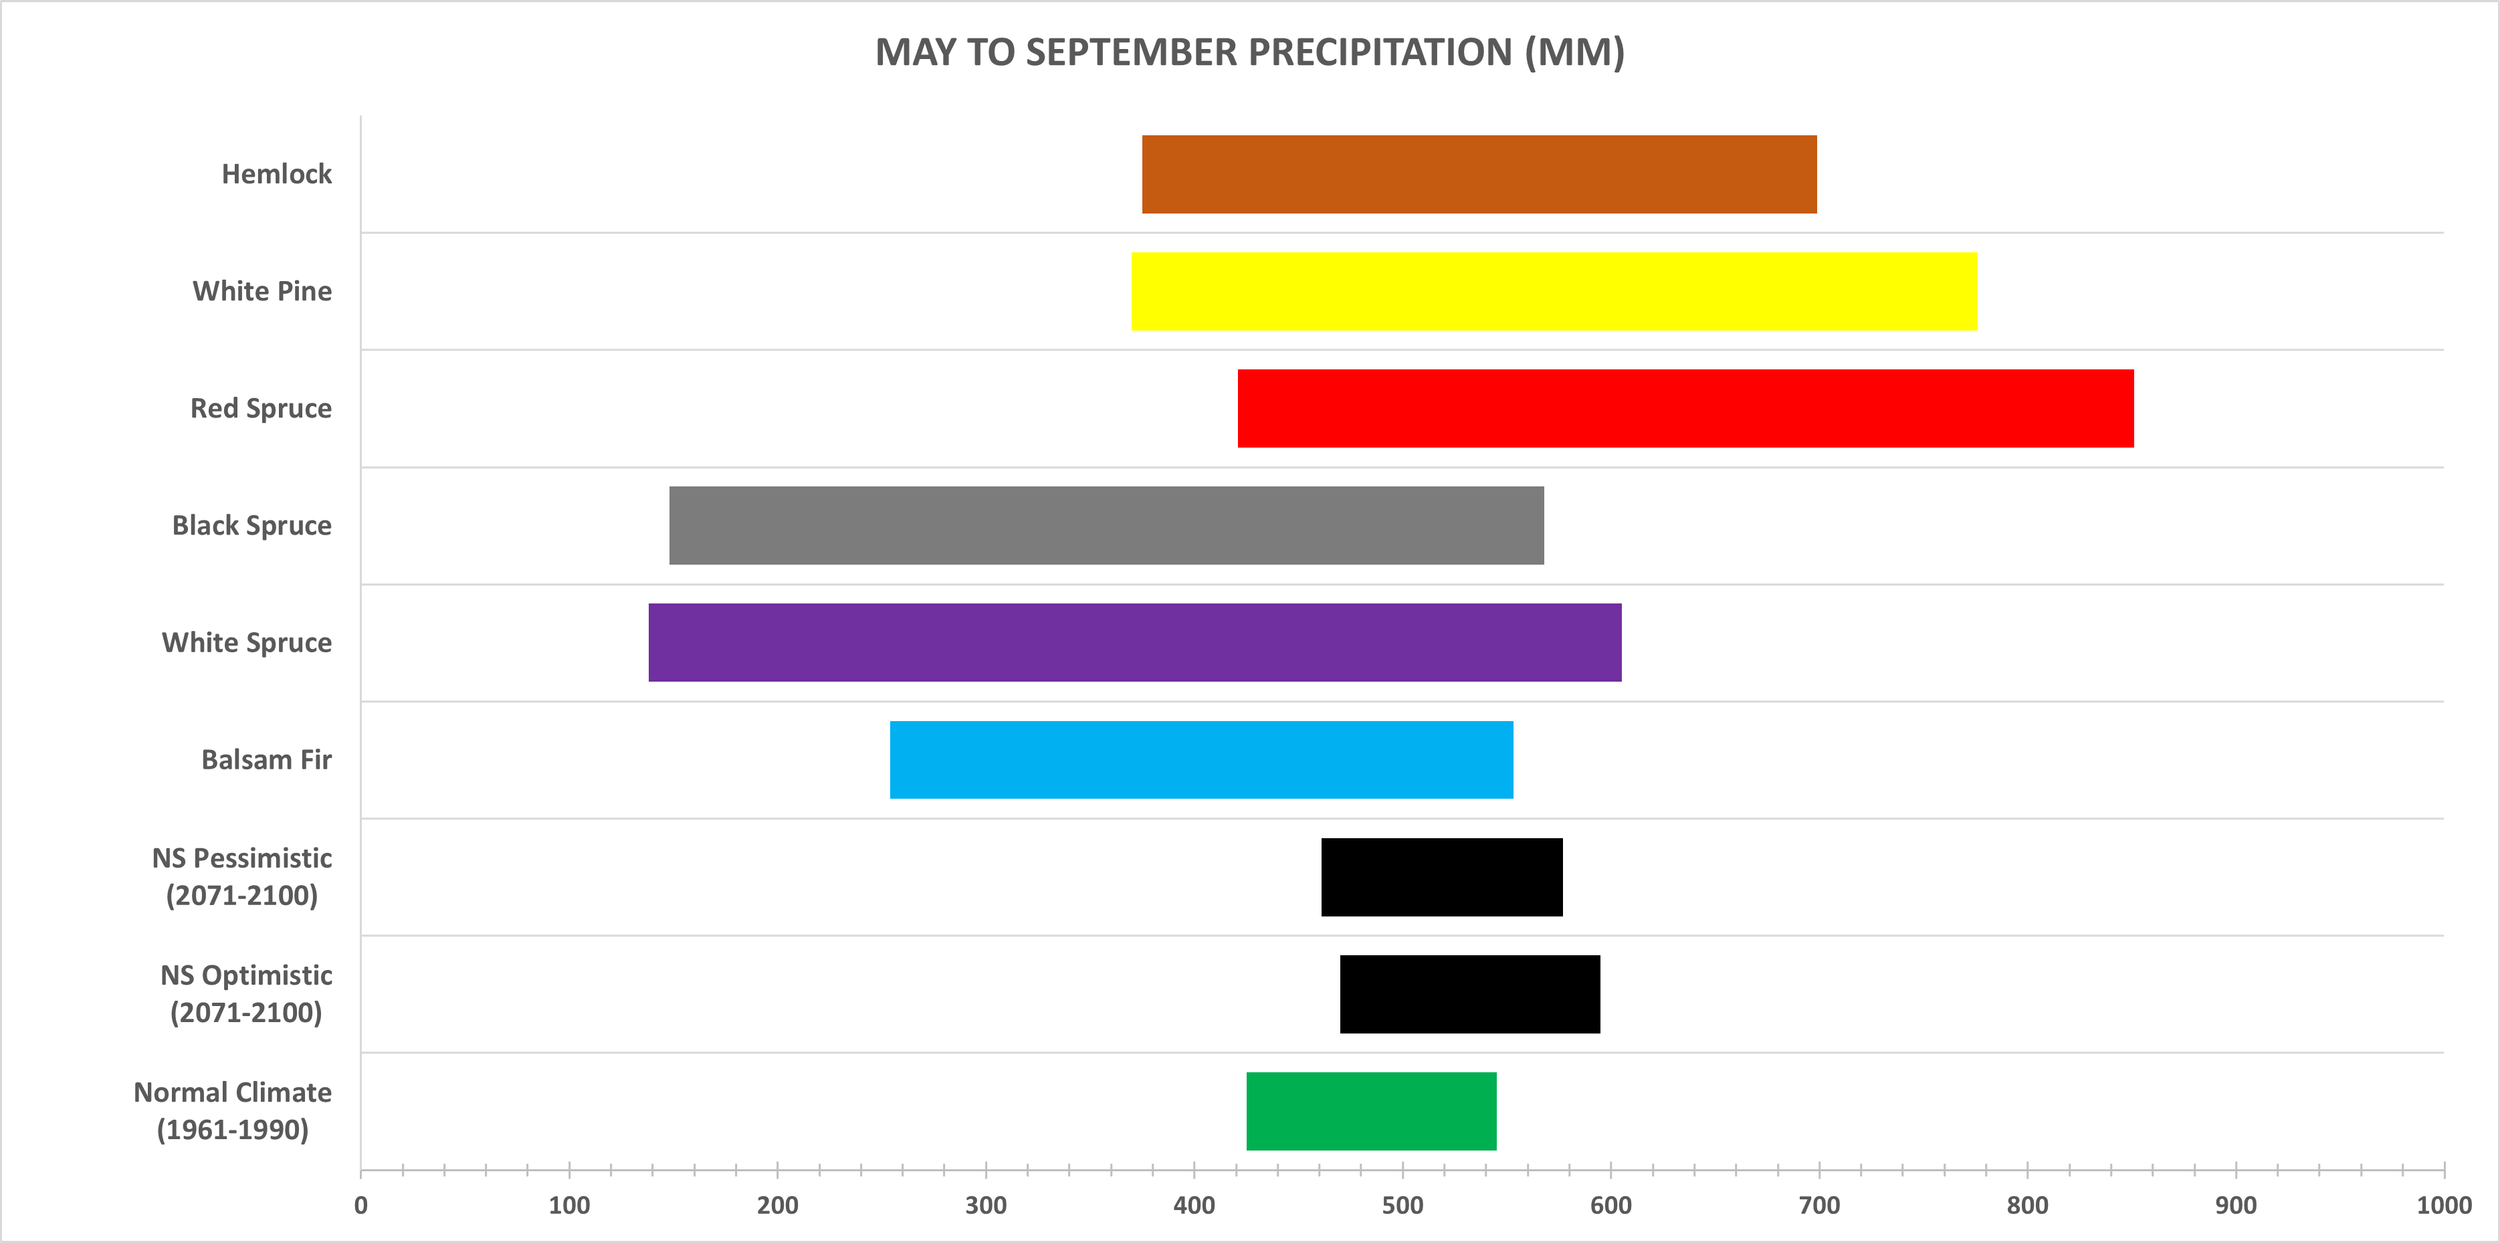
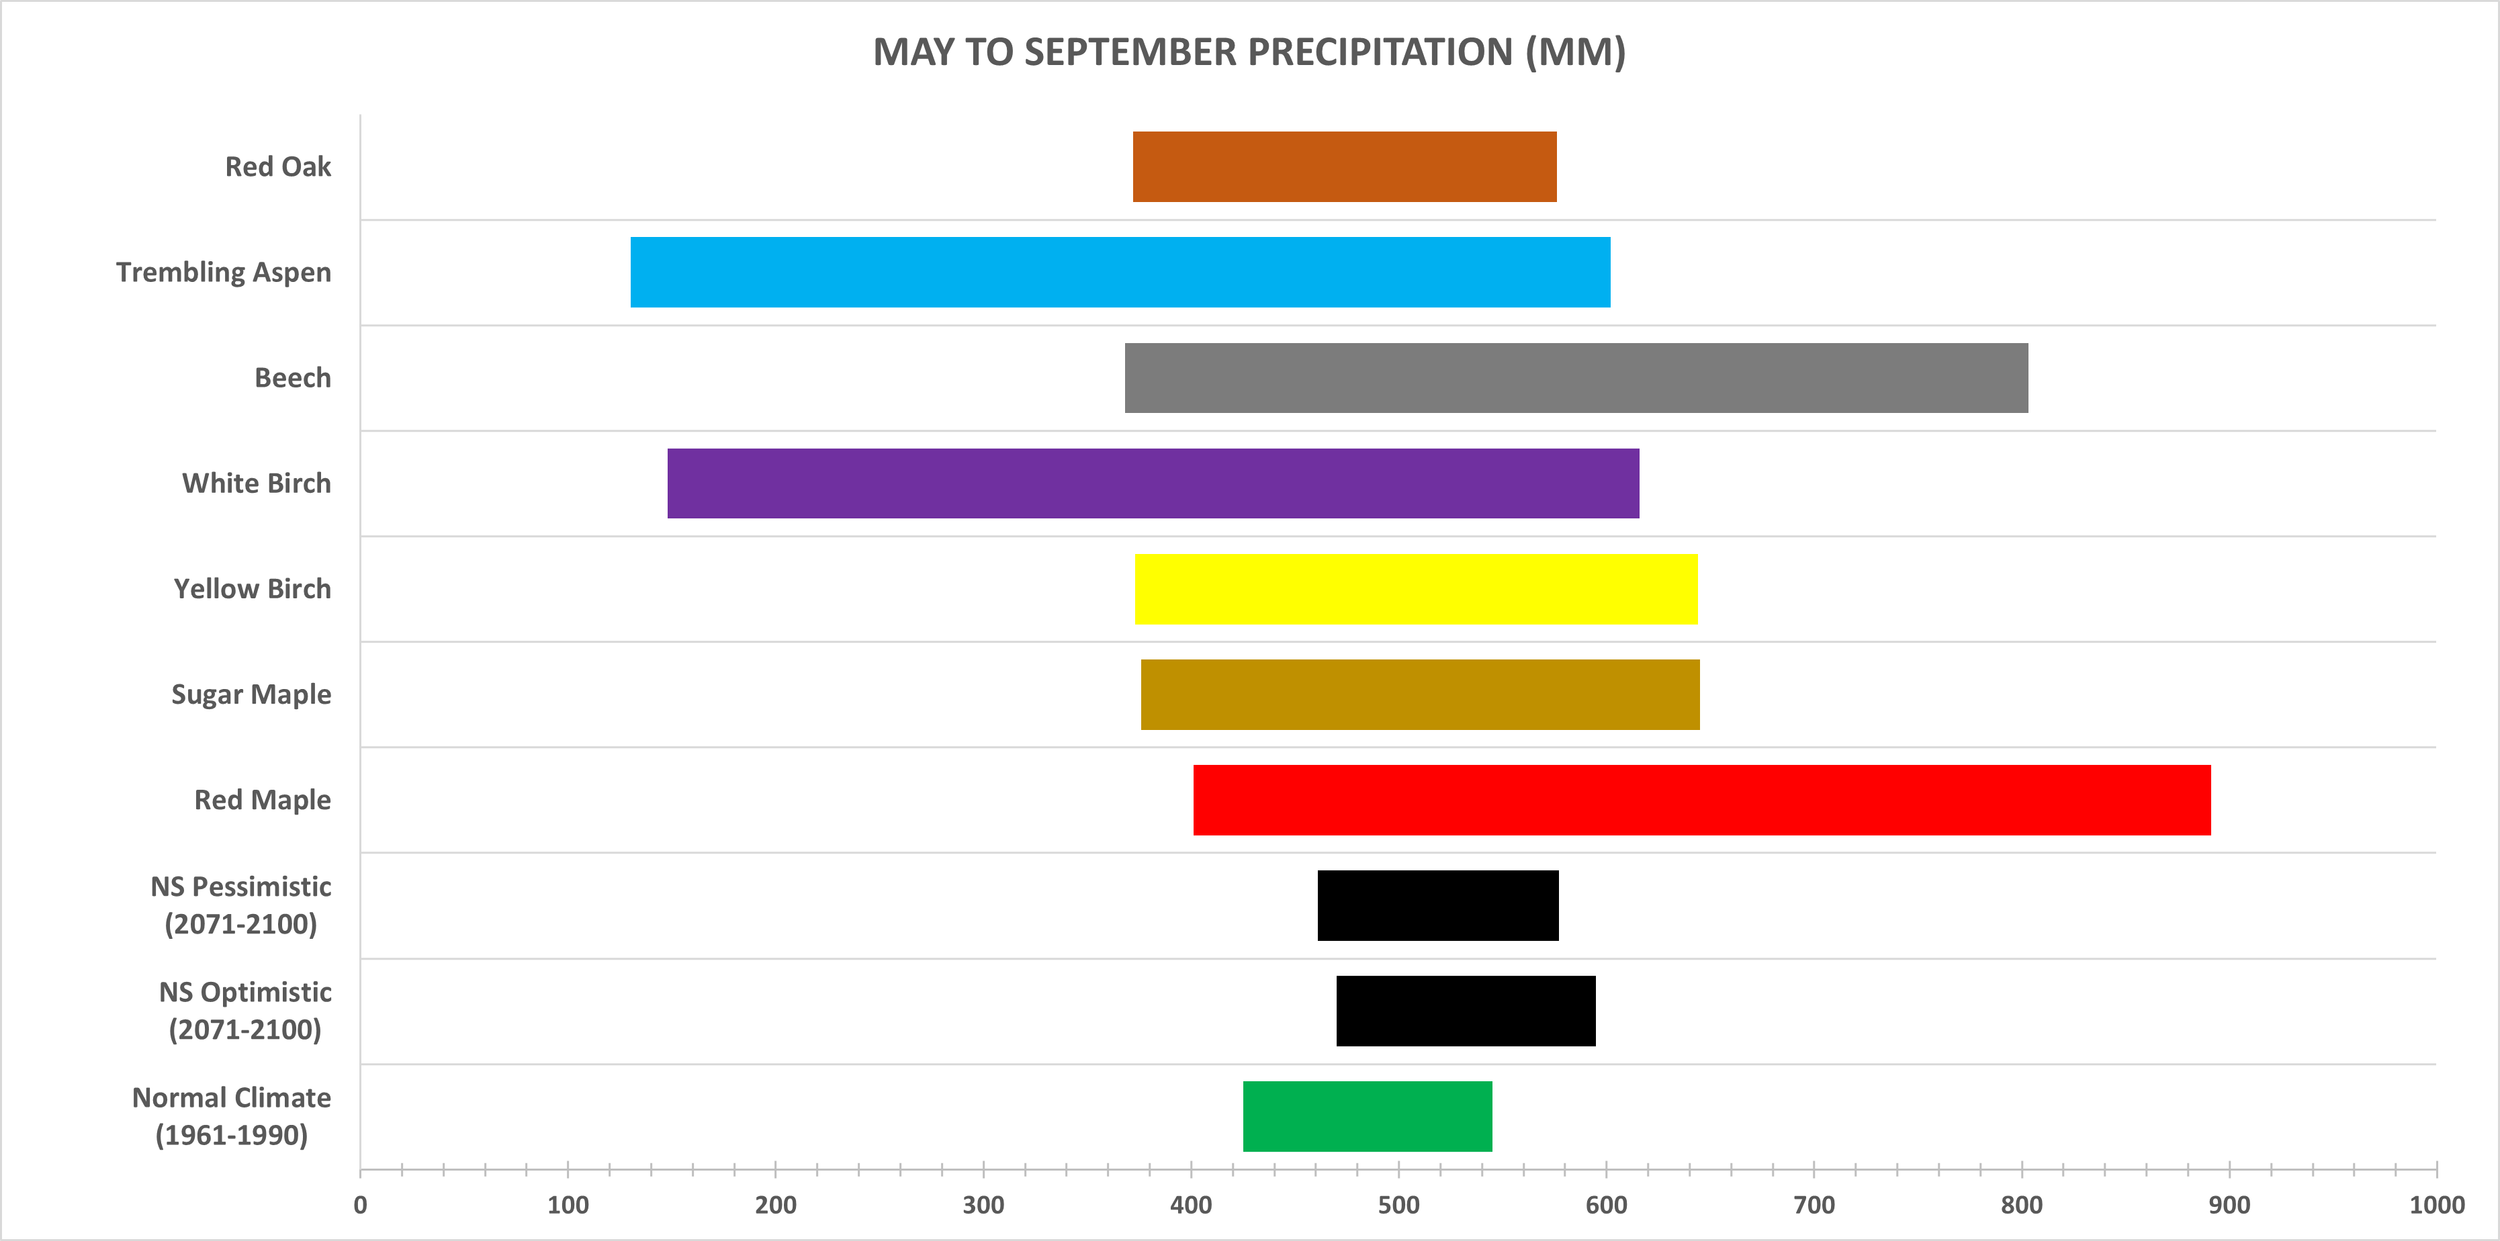
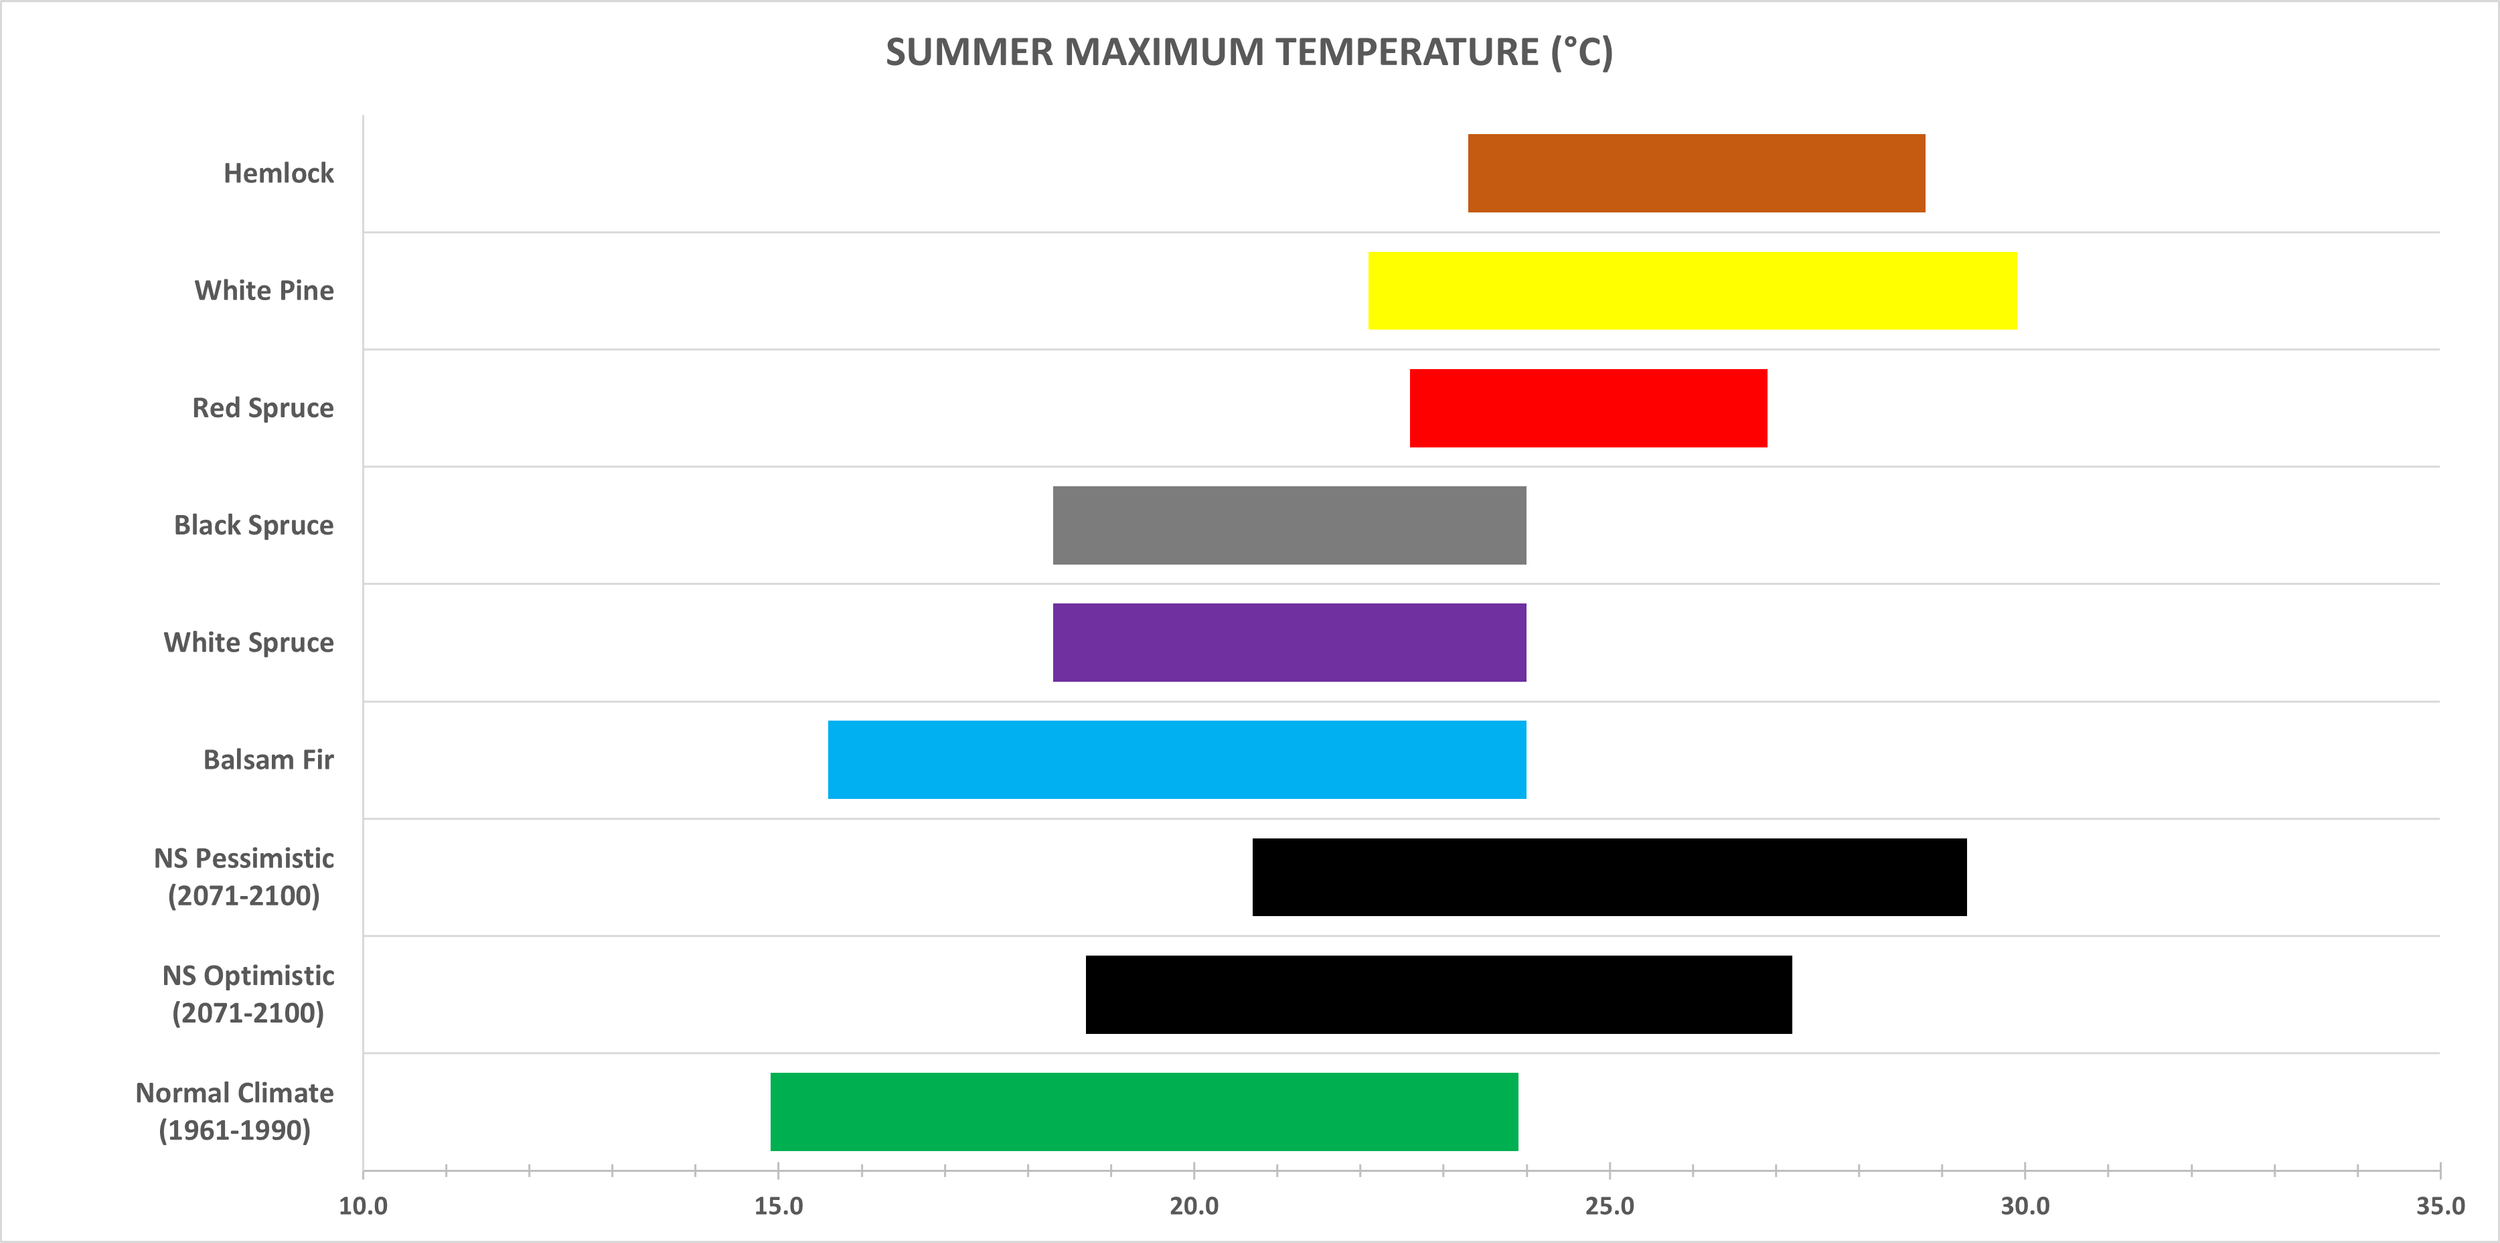
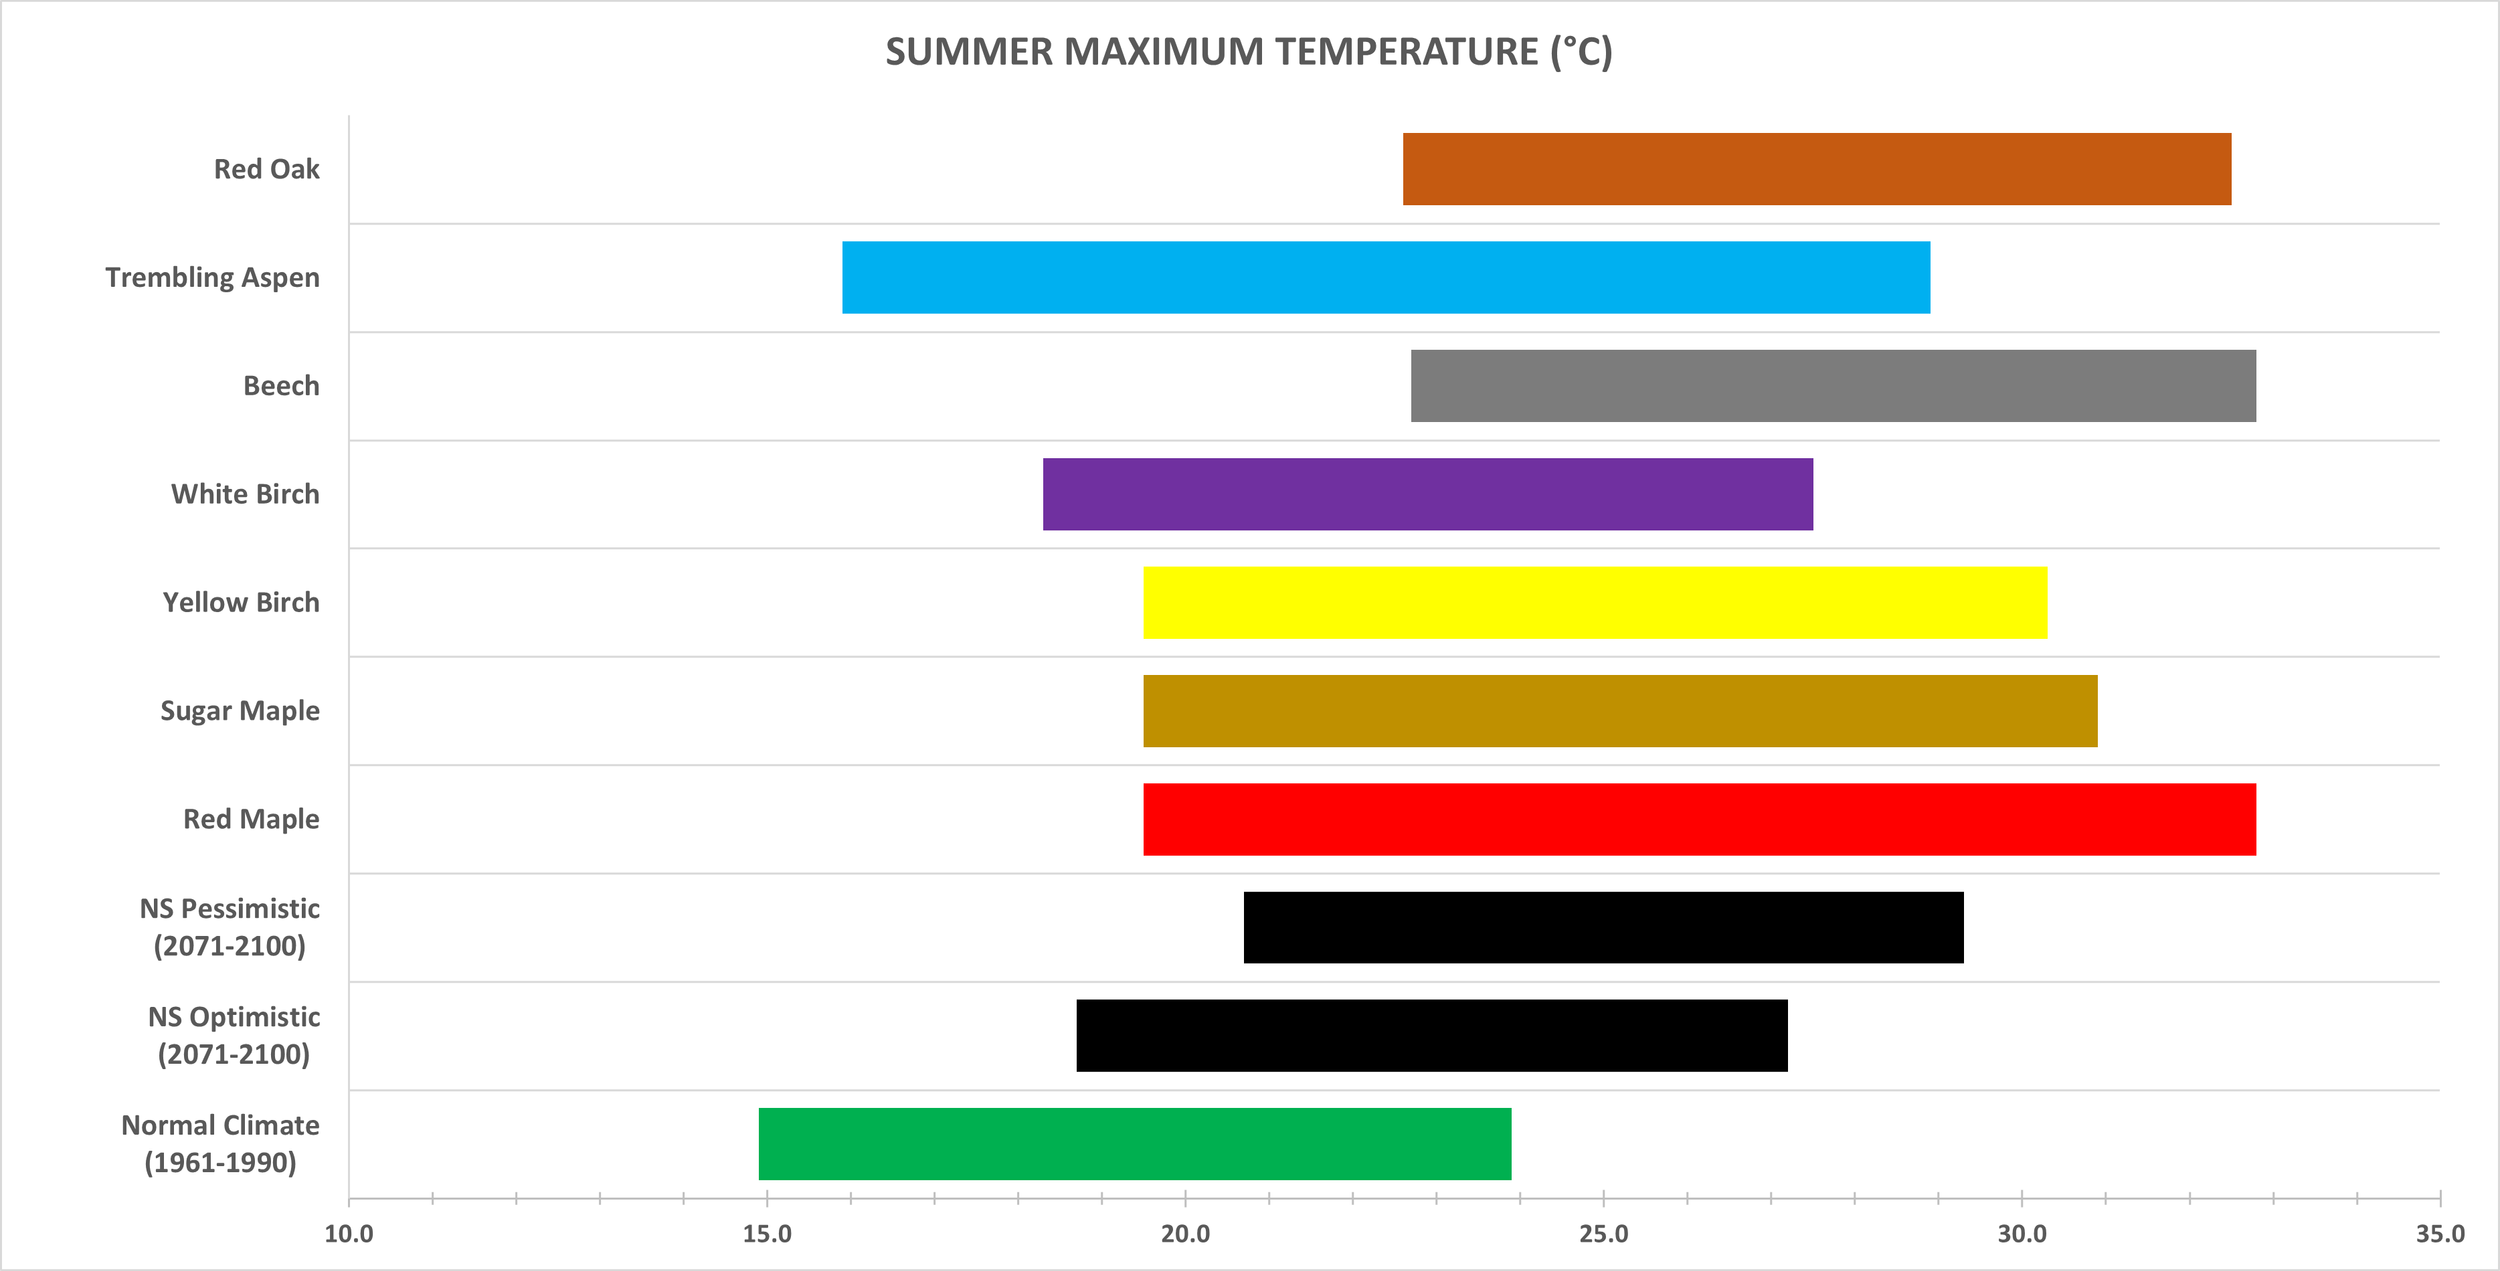
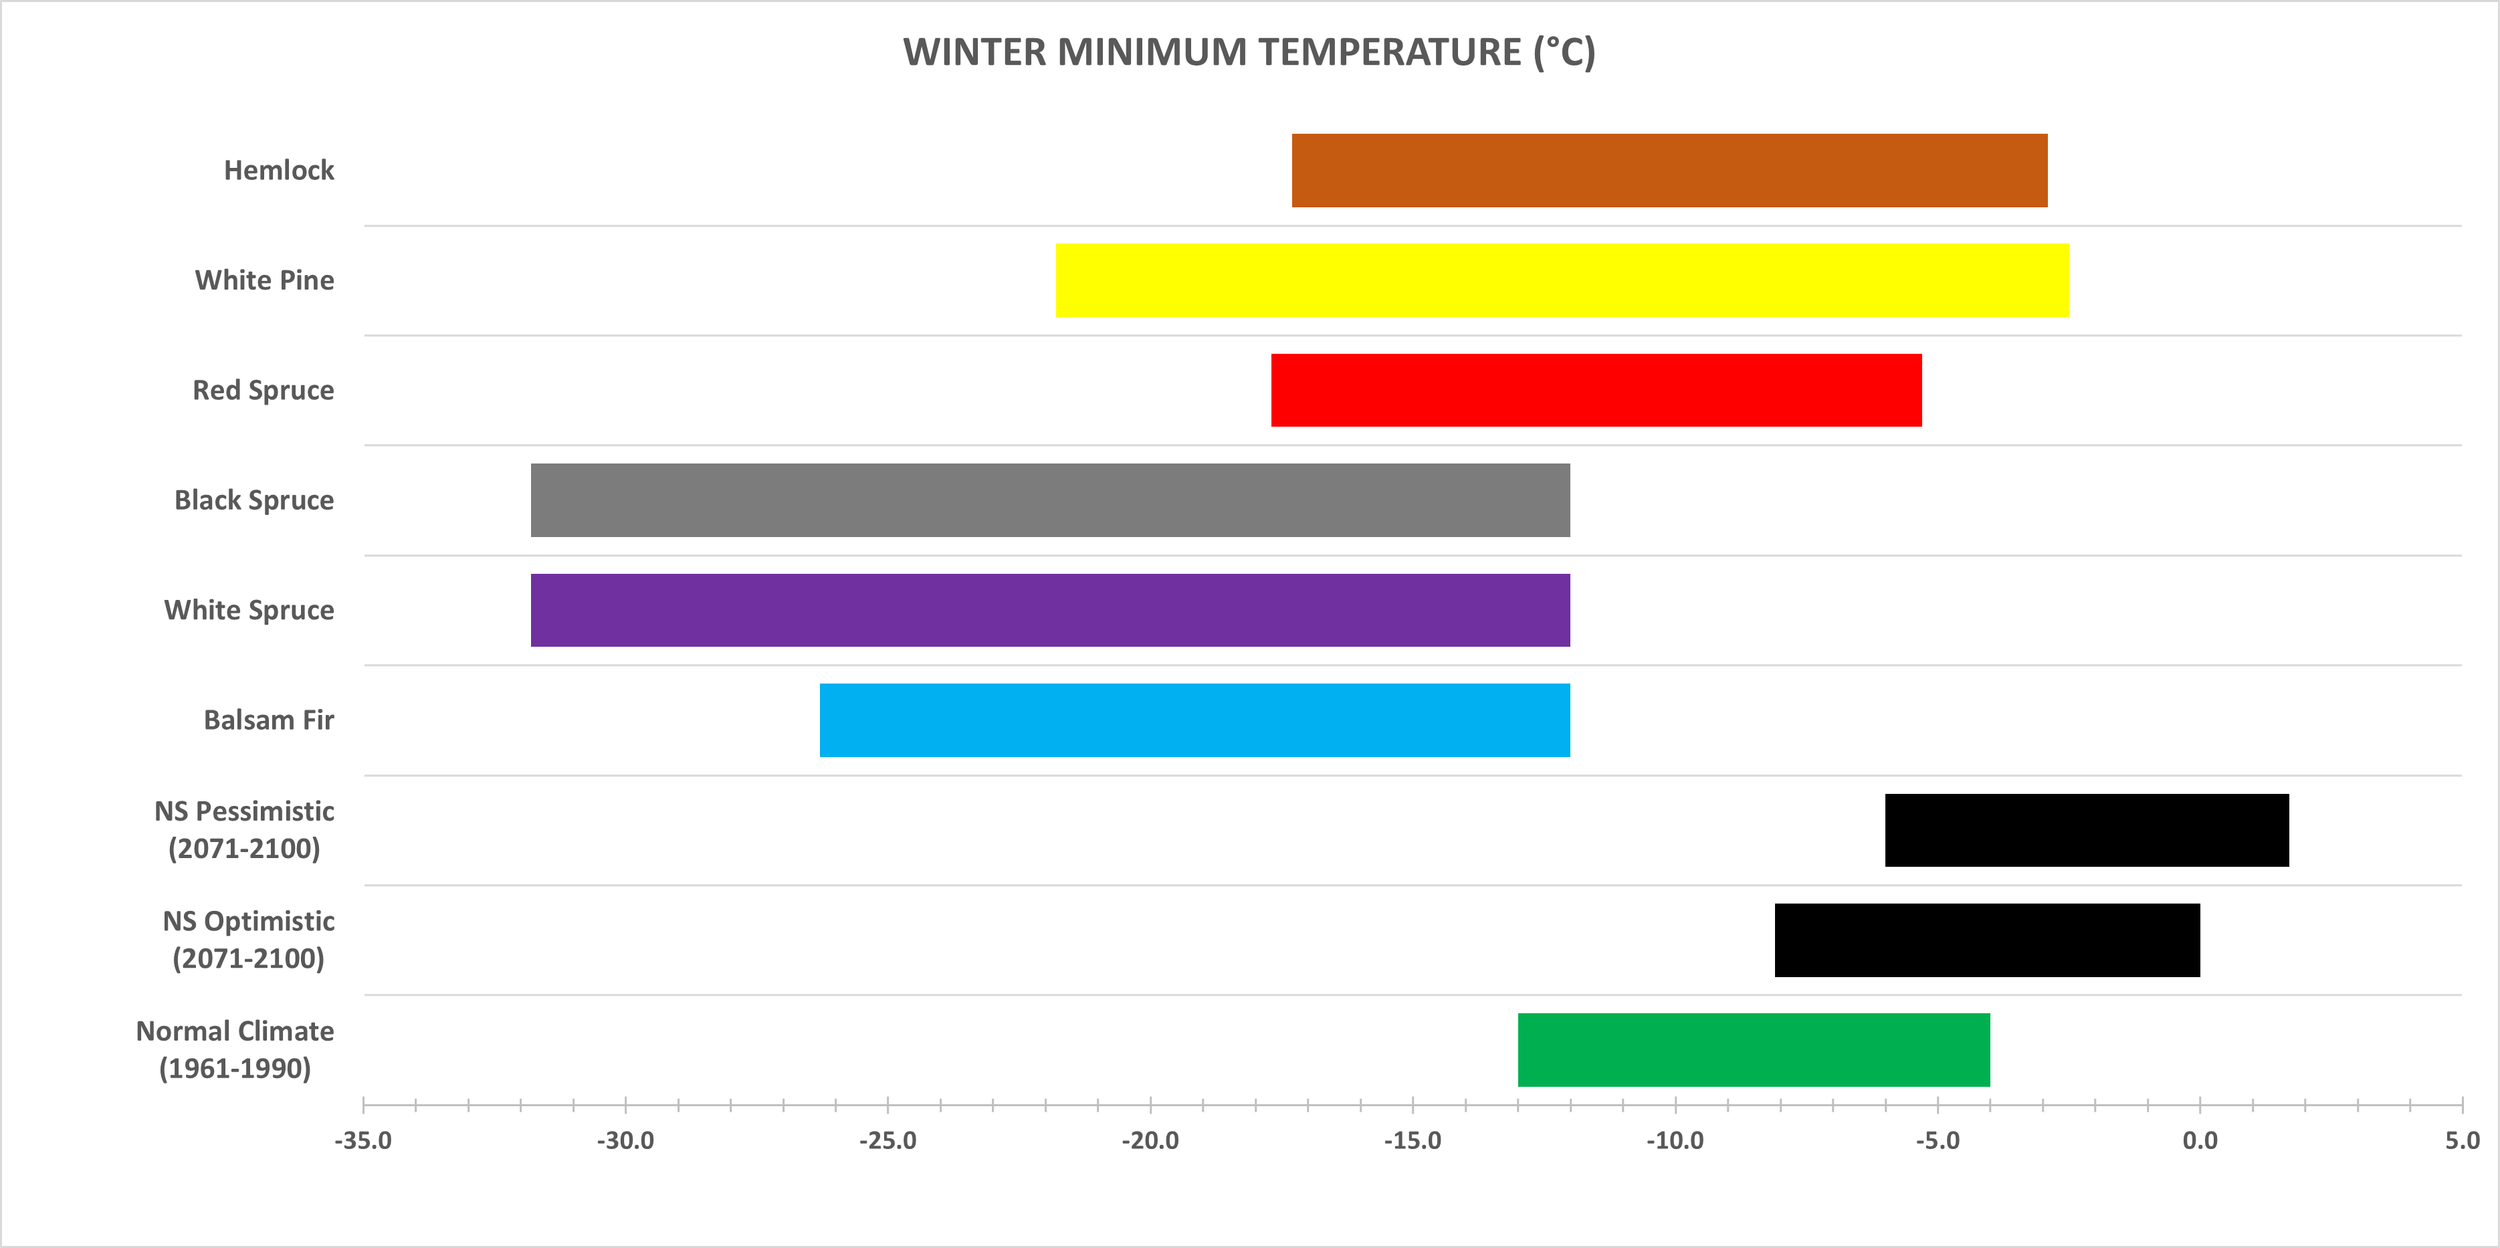
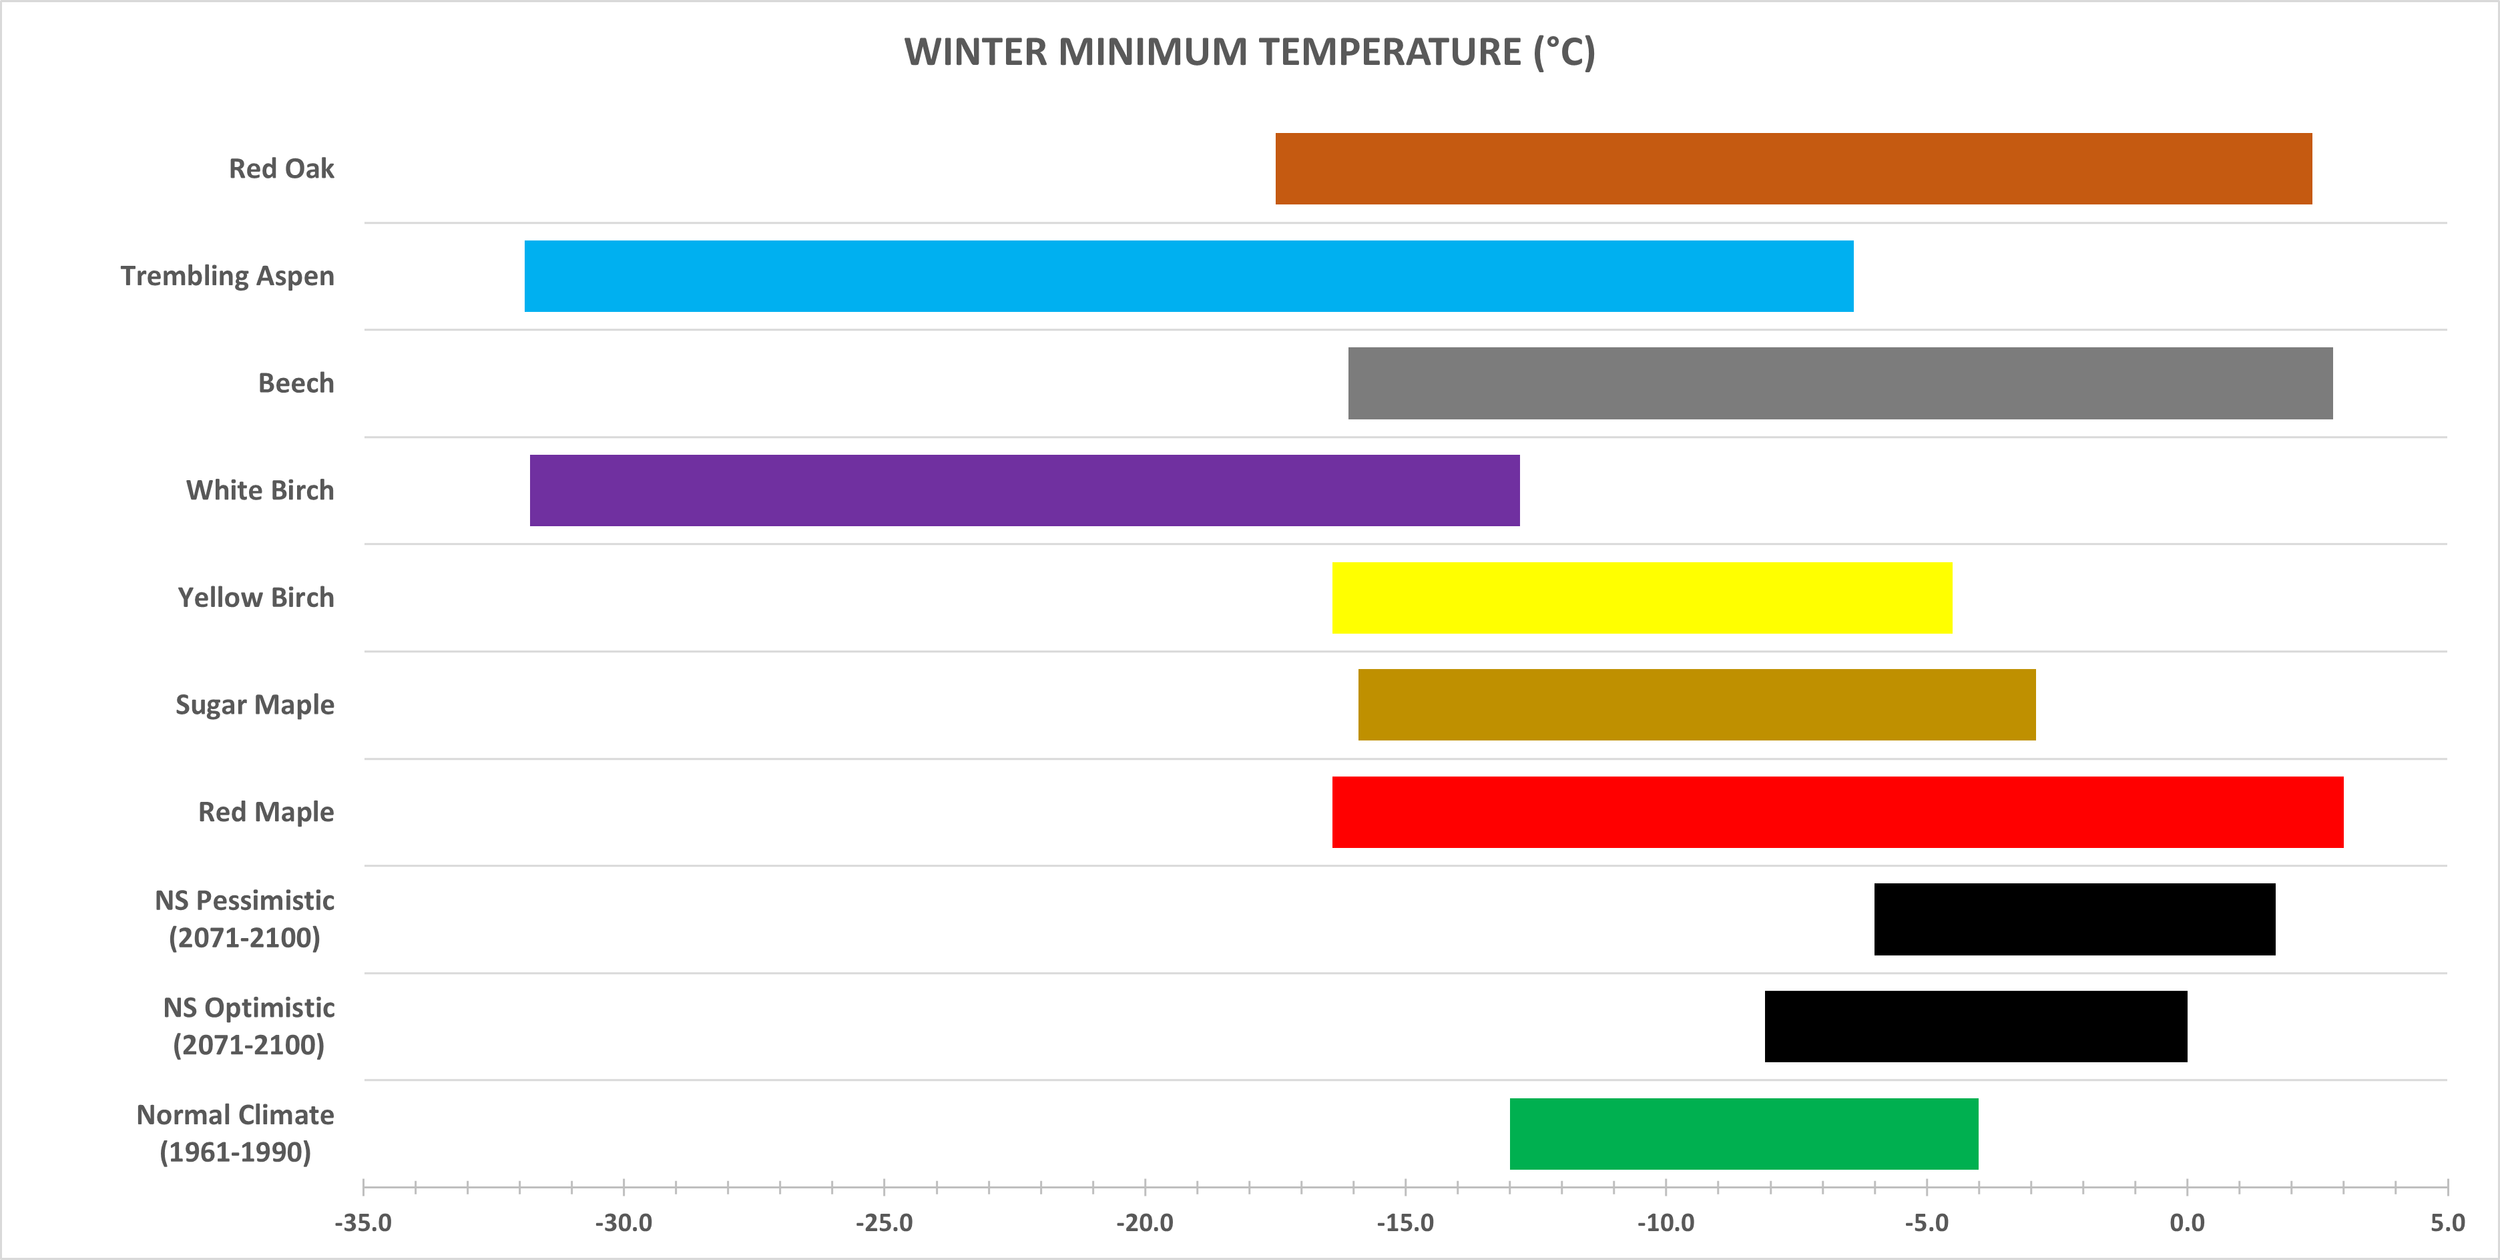
To show how climate change may affect common tree species found in Nova Scotia, we generated bar charts showing estimated low and high values for several climate related variables that affect tree growth and phenology. We did this for the 1961-1990 baseline period (Normal green bar), and for two projected climate scenarios for the period 2071-2100 (black bars). These scenarios represent what we call an optimistic development scenario (SSP2-45 “Middle of the Road”) and a pessimistic development scenario (SSP5-85 Fossil-Fueled Development). 1 All climate data were generated using the ClimateNA software package (v7.42 , 2023) (Home Page - ClimateNA).
We then used the Atlas of United States Trees (Little, 1971) to get tree species range maps, and intersected these with 1961-1990 Normal climate data maps to estimate climate variable “envelopes” associated with each tree species. Doing so allowed us to compare projected future climate conditions in Nova Scotia with the natural (historic) tolerances of tree species across their ranges.
In general, the more a tree species’ natural climate envelope deviates from projected future conditions, the more likely it is to be maladapted to those conditions. However, this cannot be stated definitively because of uncertainties in each species’ actual resilience to climate stresses (among other factors). That being said, trends shown in the charts below are consistent with recent literature that discusses climate adaptation and species suitability in the Maritime provinces (e.g., Taylor et al., 2017; de Graaf, 2018; Collier et al., 2024). 2
More boreal species such as white spruce, balsam fir, black spruce, and white birch appear to be at greater risk than other species under projected future climates; whereas more temperate species like red maple, red oak, and white pine are potentially very well adapted.
Note: Tree species range values shown in the charts below are meant to be representative, not definitive. They were generated by taking the average of 11 readings each across high and low value sections of mapped species ranges.
1. SSP stands for Shared Socioeconomic Pathway as defined in the Sixth Assessment Report of the IPCC (Intergovernmental Panel on Climate Change). SSPs outline different world-wide development scenarios, each associated with a Radiative Forcing value that is linked to projected increases in average temperature.
2. Taylor et al. 2017 - For. Ecol. Mgmt. 405: 284-294; de Graaf 2018 - Community Forests International; Collier et al. 2024 - Can. J. For. Res. 54: 134-146.